29
/
en
AIzaSyAYiBZKx7MnpbEhh9jyipgxe19OcubqV5w
April 1, 2024
24142
Arab World
ARB
false
2
1
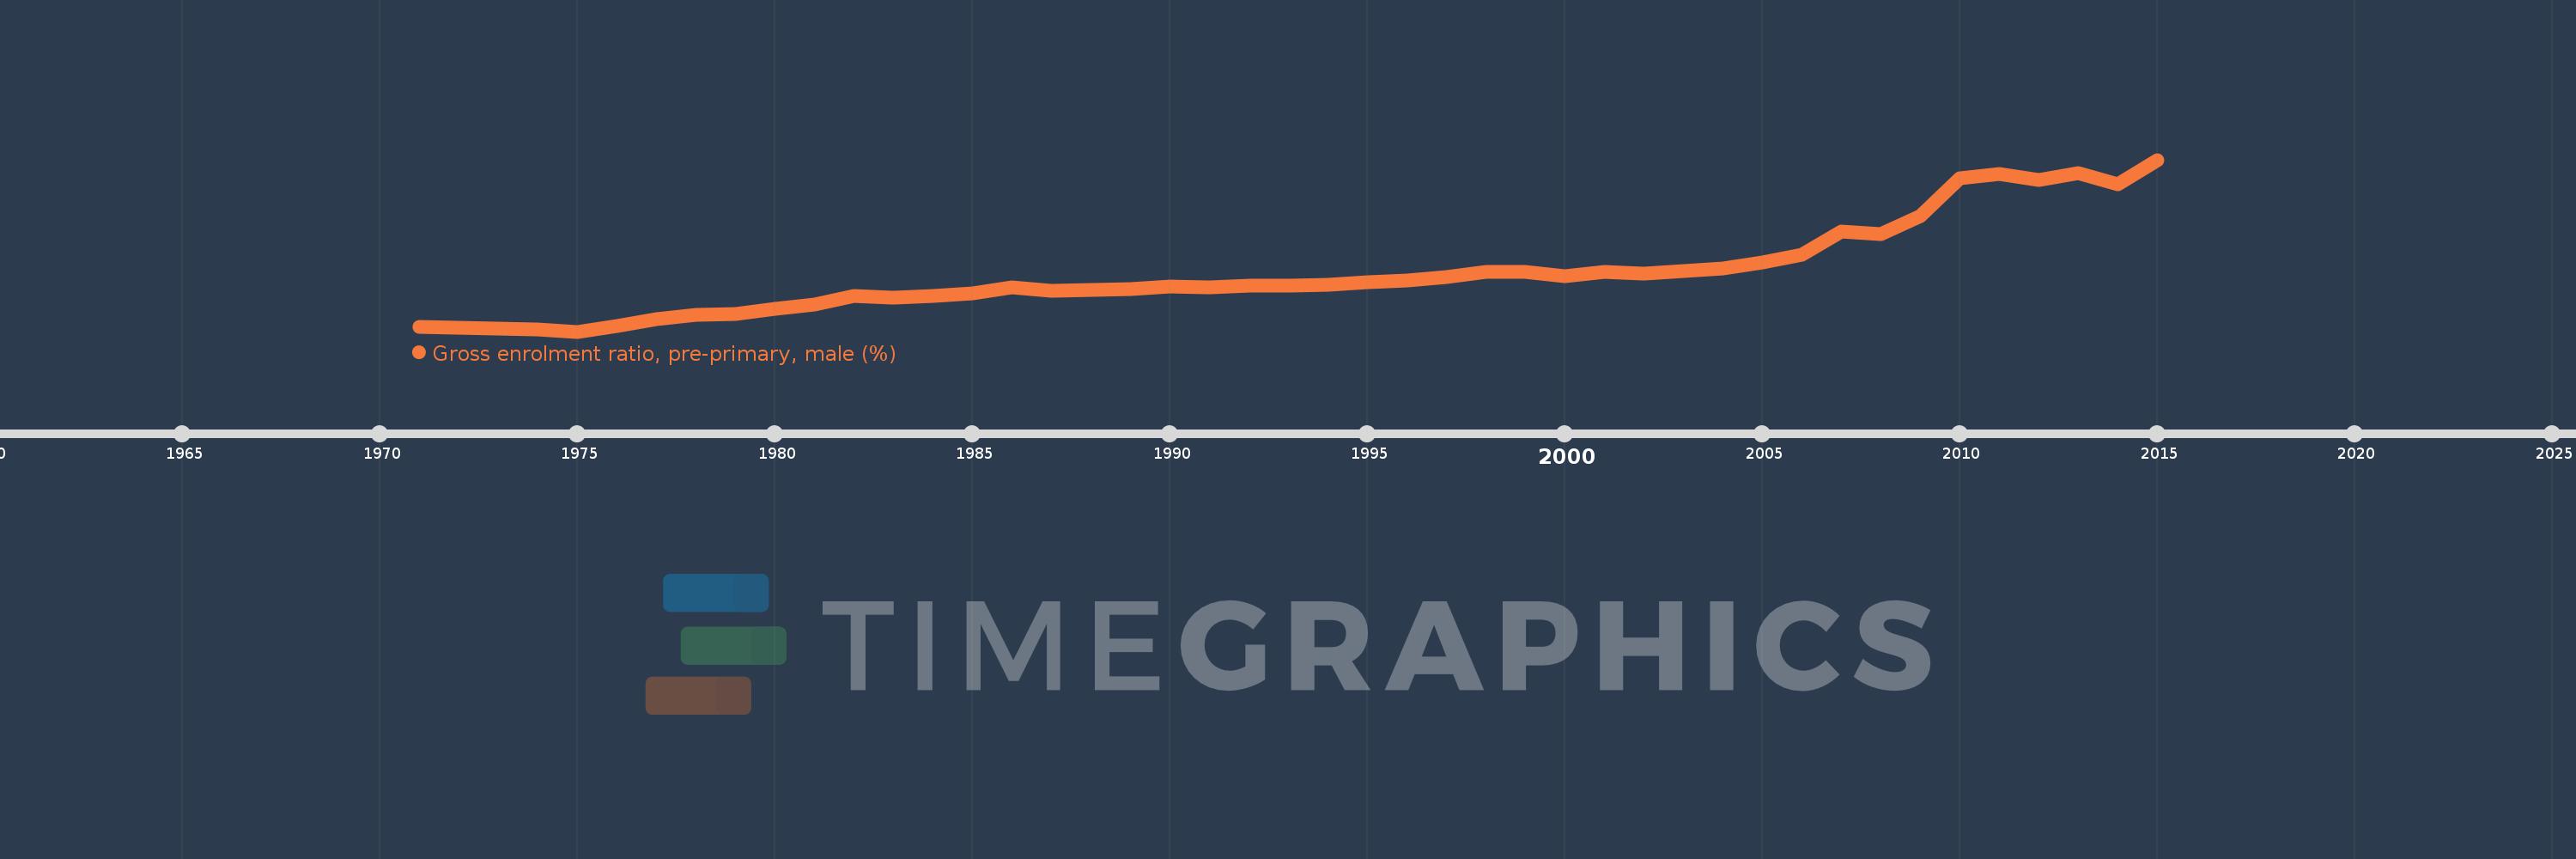
Gross enrolment ratio, pre-primary, male (%)
2015,2014,2013,2012,2011,2010,2009,2008,2007,2006,2005,2004,2003,2002,2001,2000,1999,1998,1997,1996,1995,1994,1993,1992,1991,1990,1989,1988,1987,1986,1985,1984,1983,1982,1981,1980,1979,1978,1977,1976,1975,1974,1973,1972,1971
This statistics in other country:
AfghanistanAlbaniaAlgeriaAndorraAngolaAntigua and BarbudaArab WorldArgentinaArmeniaArubaAustraliaAustriaAzerbaijanBahamas, TheBahrainBangladeshBarbadosBelarusBelgiumBelizeBeninBermudaBhutanBoliviaBosnia and HerzegovinaBotswanaBrazilBrunei DarussalamBulgariaBurkina FasoBurundiCabo VerdeCambodiaCameroonCanadaCaribbean small statesCentral African RepublicCentral Europe and the BalticsChadChileChinaColombiaComorosCongo, Dem. Rep.Congo, Rep.Costa RicaCote d'IvoireCroatiaCubaCyprusCzech RepublicDenmarkDjiboutiDominicaDominican RepublicEarly-demographic dividendEast Asia & PacificEast Asia & Pacific (excluding high income)East Asia & Pacific (IDA & IBRD countries)EcuadorEgypt, Arab Rep.El SalvadorEquatorial GuineaEritreaEstoniaEthiopiaEuro areaEurope & Central AsiaEurope & Central Asia (excluding high income)Europe & Central Asia (IDA & IBRD countries)European UnionFijiFinlandFragile and conflict affected situationsFranceGabonGambia, TheGeorgiaGermanyGhanaGreeceGrenadaGuatemalaGuineaGuinea-BissauGuyanaHeavily indebted poor countries (HIPC)High incomeHondurasHong Kong SAR, ChinaHungaryIBRD onlyIcelandIDA & IBRD totalIDA blendIDA onlyIDA totalIndiaIndonesiaIran, Islamic Rep.IraqIrelandIsraelItalyJamaicaJapanJordanKazakhstanKenyaKorea, Dem. People’s Rep.Korea, Rep.KuwaitKyrgyz RepublicLao PDRLate-demographic dividendLatin America & Caribbean Latin America & Caribbean (excluding high income)Latin America & the Caribbean (IDA & IBRD countries)LatviaLeast developed countries: UN classificationLebanonLesothoLiberiaLibyaLiechtensteinLithuaniaLow & middle incomeLow incomeLower middle incomeLuxembourgMacao SAR, ChinaMacedonia, FYRMadagascarMaldivesMaliMaltaMarshall IslandsMauritaniaMauritiusMexicoMicronesia, Fed. Sts.Middle East & North AfricaMiddle East & North Africa (excluding high income)Middle East & North Africa (IDA & IBRD countries)Middle incomeMoldovaMongoliaMontenegroMoroccoMozambiqueMyanmarNamibiaNauruNepalNetherlandsNew ZealandNicaraguaNigerNigeriaNorth AmericaNorwayOECD membersOmanOther small statesPacific island small statesPakistanPalauPanamaPapua New GuineaParaguayPeruPhilippinesPolandPortugalPost-demographic dividendPre-demographic dividendPuerto RicoQatarRomaniaRussian FederationRwandaSamoaSan MarinoSao Tome and PrincipeSaudi ArabiaSenegalSerbiaSeychellesSierra LeoneSlovak RepublicSloveniaSmall statesSolomon IslandsSomaliaSouth AfricaSouth AsiaSouth Asia (IDA & IBRD)South SudanSpainSri LankaSt. Kitts and NevisSt. LuciaSt. Vincent and the GrenadinesSub-Saharan Africa Sub-Saharan Africa (excluding high income)Sub-Saharan Africa (IDA & IBRD countries)SudanSurinameSwazilandSwedenSwitzerlandSyrian Arab RepublicTajikistanTanzaniaThailandTimor-LesteTogoTongaTrinidad and TobagoTunisiaTurkeyTurkmenistanTuvaluUgandaUkraineUnited Arab EmiratesUnited KingdomUnited StatesUpper middle incomeUruguayUzbekistanVanuatuVenezuela, RBVietnamWest Bank and GazaWorldYemen, Rep.Zimbabwe Timeline:
This timeline shows a graph from 1971 to 2015 of Arab World. No data until 1970. Number of actual observations by date: 45.
Source name:
World Development Indicators
Source organization:
UNESCO Institute for Statistics
Categories, topics:
Education, Gender
Last updated:
apr 23, 2017
Indicators value changes by year
Minimum:
11.046
jan 1, 1975
Maximum:
25.628
jan 1, 2015
At the date of observation
Value
Absolute change
Change from previous value
jan 1, 1971
11.481
+11.481
0.0%
jan 1, 1972
11.399
-0.082
-0.71%
jan 1, 1973
11.318
-0.081
-0.71%
jan 1, 1974
11.235
-0.083
-0.73%
jan 1, 1975
11.046
-0.189
-1.69%
jan 1, 1976
11.49
+0.444
4.02%
jan 1, 1977
12.081
+0.591
5.15%
jan 1, 1978
12.462
+0.381
3.15%
jan 1, 1979
12.554
+0.092
0.74%
jan 1, 1980
12.993
+0.439
3.5%
jan 1, 1981
13.344
+0.35
2.7%
jan 1, 1982
14.038
+0.694
5.2%
jan 1, 1983
13.922
-0.116
-0.83%
jan 1, 1984
14.081
+0.159
1.14%
jan 1, 1985
14.272
+0.191
1.36%
jan 1, 1986
14.765
+0.493
3.46%
jan 1, 1987
14.537
-0.228
-1.55%
jan 1, 1988
14.592
+0.055
0.38%
jan 1, 1989
14.636
+0.044
0.3%
jan 1, 1990
14.868
+0.232
1.58%
jan 1, 1991
14.817
-0.05
-0.34%
jan 1, 1992
14.92
+0.103
0.69%
jan 1, 1993
14.925
+0.006
0.04%
jan 1, 1994
15.017
+0.092
0.62%
jan 1, 1995
15.213
+0.195
1.3%
jan 1, 1996
15.348
+0.135
0.89%
jan 1, 1997
15.646
+0.298
1.94%
jan 1, 1998
16.087
+0.441
2.82%
jan 1, 1999
16.095
+0.009
0.05%
jan 1, 2000
15.759
-0.336
-2.09%
jan 1, 2001
16.127
+0.367
2.33%
jan 1, 2002
15.947
-0.18
-1.12%
jan 1, 2003
16.217
+0.271
1.7%
jan 1, 2004
16.394
+0.177
1.09%
jan 1, 2005
16.879
+0.484
2.95%
jan 1, 2006
17.598
+0.719
4.26%
jan 1, 2007
19.51
+1.912
10.87%
jan 1, 2008
19.299
-0.211
-1.08%
jan 1, 2009
20.834
+1.535
7.95%
jan 1, 2010
24.046
+3.212
15.42%
jan 1, 2011
24.39
+0.343
1.43%
jan 1, 2012
23.944
-0.446
-1.83%
jan 1, 2013
24.497
+0.553
2.31%
jan 1, 2014
23.52
-0.977
-3.99%
jan 1, 2015
25.628
+2.108
8.96%
Ranking of countries by current statistics by years


Comments: