29
/
en
AIzaSyAYiBZKx7MnpbEhh9jyipgxe19OcubqV5w
April 1, 2024
215331
Oman
OMN
true
2
1
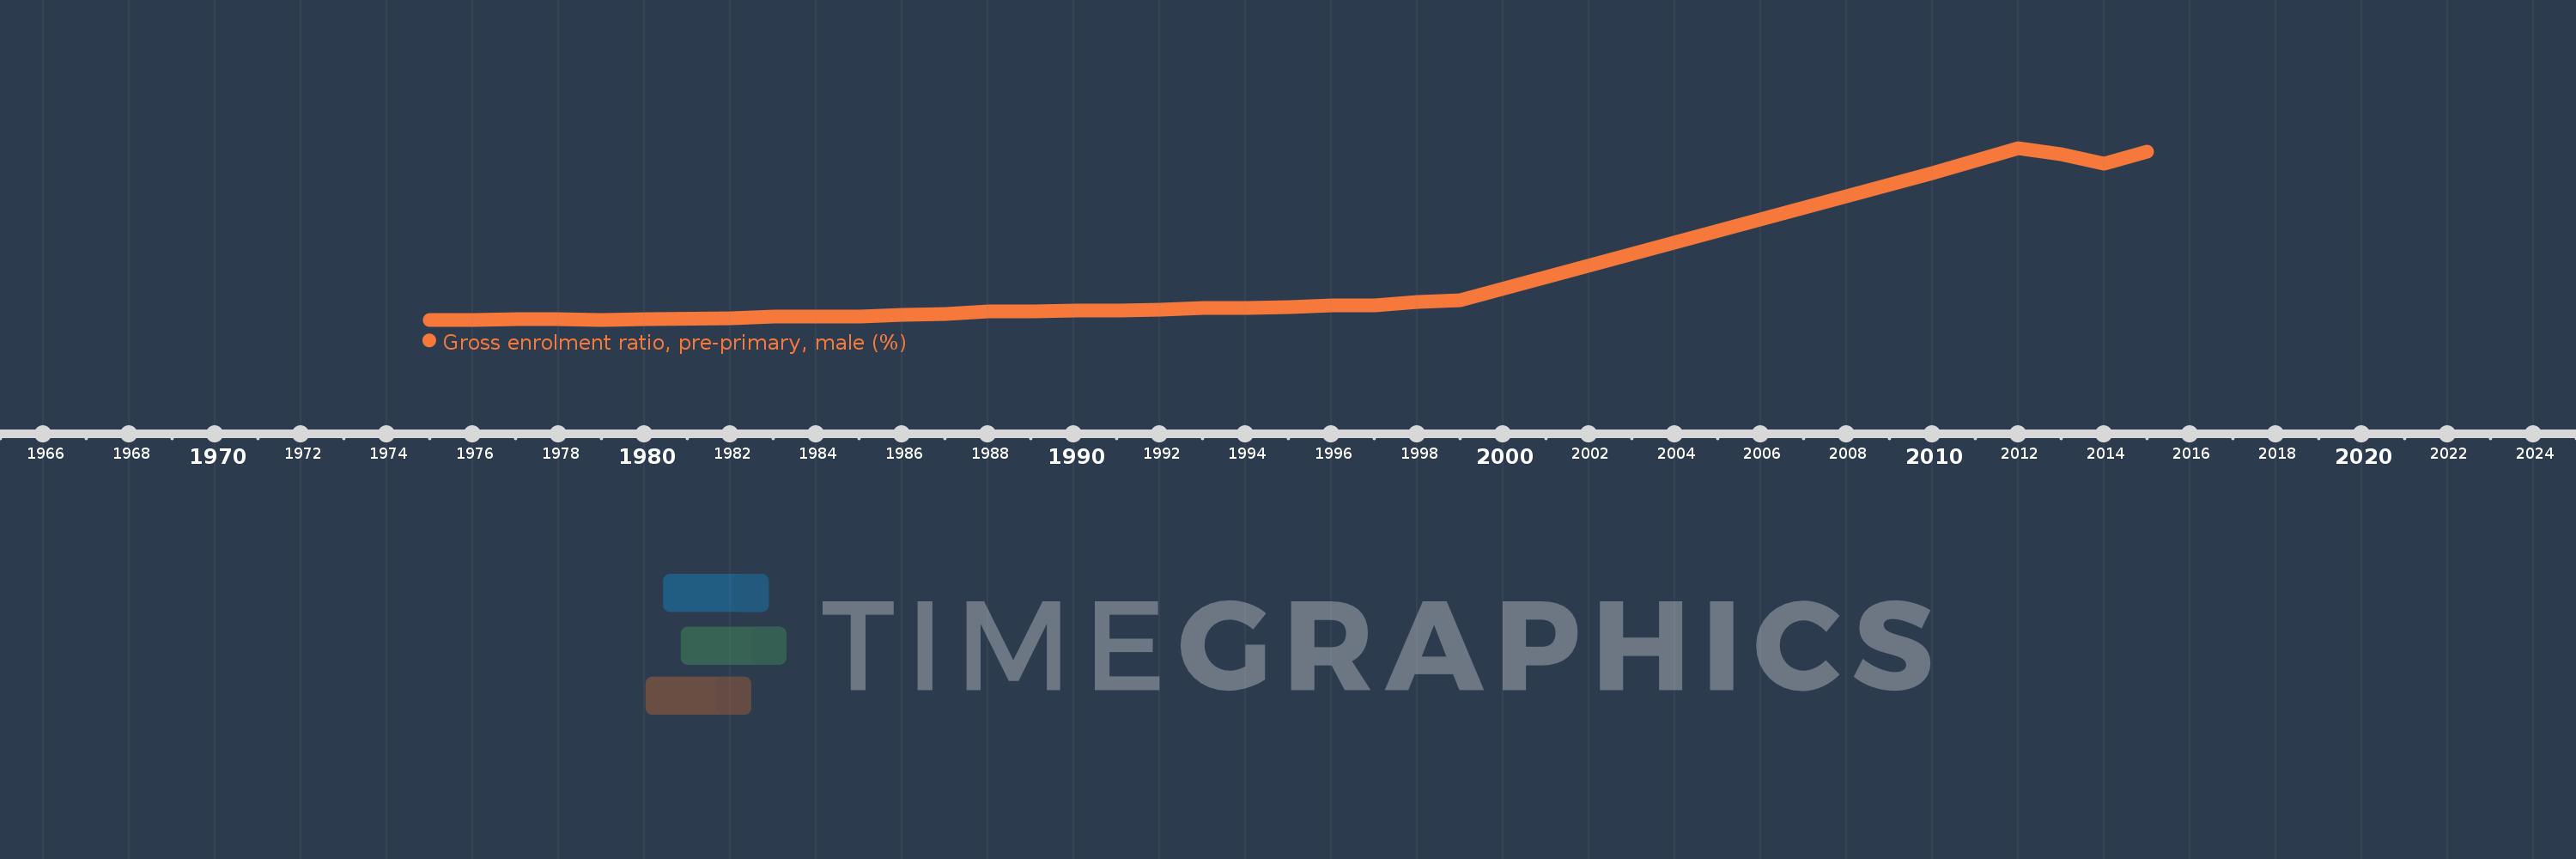
Gross enrolment ratio, pre-primary, male (%)
2015,2014,2013,2012,2010,1999,1998,1997,1996,1995,1994,1993,1992,1991,1990,1989,1988,1987,1986,1985,1984,1983,1982,1980,1979,1978,1977,1976,1975
This statistics in other country:
AfghanistanAlbaniaAlgeriaAndorraAngolaAntigua and BarbudaArab WorldArgentinaArmeniaArubaAustraliaAustriaAzerbaijanBahamas, TheBahrainBangladeshBarbadosBelarusBelgiumBelizeBeninBermudaBhutanBoliviaBosnia and HerzegovinaBotswanaBrazilBrunei DarussalamBulgariaBurkina FasoBurundiCabo VerdeCambodiaCameroonCanadaCaribbean small statesCentral African RepublicCentral Europe and the BalticsChadChileChinaColombiaComorosCongo, Dem. Rep.Congo, Rep.Costa RicaCote d'IvoireCroatiaCubaCyprusCzech RepublicDenmarkDjiboutiDominicaDominican RepublicEarly-demographic dividendEast Asia & PacificEast Asia & Pacific (excluding high income)East Asia & Pacific (IDA & IBRD countries)EcuadorEgypt, Arab Rep.El SalvadorEquatorial GuineaEritreaEstoniaEthiopiaEuro areaEurope & Central AsiaEurope & Central Asia (excluding high income)Europe & Central Asia (IDA & IBRD countries)European UnionFijiFinlandFragile and conflict affected situationsFranceGabonGambia, TheGeorgiaGermanyGhanaGreeceGrenadaGuatemalaGuineaGuinea-BissauGuyanaHeavily indebted poor countries (HIPC)High incomeHondurasHong Kong SAR, ChinaHungaryIBRD onlyIcelandIDA & IBRD totalIDA blendIDA onlyIDA totalIndiaIndonesiaIran, Islamic Rep.IraqIrelandIsraelItalyJamaicaJapanJordanKazakhstanKenyaKorea, Dem. People’s Rep.Korea, Rep.KuwaitKyrgyz RepublicLao PDRLate-demographic dividendLatin America & Caribbean Latin America & Caribbean (excluding high income)Latin America & the Caribbean (IDA & IBRD countries)LatviaLeast developed countries: UN classificationLebanonLesothoLiberiaLibyaLiechtensteinLithuaniaLow & middle incomeLow incomeLower middle incomeLuxembourgMacao SAR, ChinaMacedonia, FYRMadagascarMaldivesMaliMaltaMarshall IslandsMauritaniaMauritiusMexicoMicronesia, Fed. Sts.Middle East & North AfricaMiddle East & North Africa (excluding high income)Middle East & North Africa (IDA & IBRD countries)Middle incomeMoldovaMongoliaMontenegroMoroccoMozambiqueMyanmarNamibiaNauruNepalNetherlandsNew ZealandNicaraguaNigerNigeriaNorth AmericaNorwayOECD membersOmanOther small statesPacific island small statesPakistanPalauPanamaPapua New GuineaParaguayPeruPhilippinesPolandPortugalPost-demographic dividendPre-demographic dividendPuerto RicoQatarRomaniaRussian FederationRwandaSamoaSan MarinoSao Tome and PrincipeSaudi ArabiaSenegalSerbiaSeychellesSierra LeoneSlovak RepublicSloveniaSmall statesSolomon IslandsSomaliaSouth AfricaSouth AsiaSouth Asia (IDA & IBRD)South SudanSpainSri LankaSt. Kitts and NevisSt. LuciaSt. Vincent and the GrenadinesSub-Saharan Africa Sub-Saharan Africa (excluding high income)Sub-Saharan Africa (IDA & IBRD countries)SudanSurinameSwazilandSwedenSwitzerlandSyrian Arab RepublicTajikistanTanzaniaThailandTimor-LesteTogoTongaTrinidad and TobagoTunisiaTurkeyTurkmenistanTuvaluUgandaUkraineUnited Arab EmiratesUnited KingdomUnited StatesUpper middle incomeUruguayUzbekistanVanuatuVenezuela, RBVietnamWest Bank and GazaWorldYemen, Rep.Zimbabwe Timeline:
This timeline shows a graph from 1975 to 2015 of Oman. No data until 1974. Number of actual observations by date: 29.
Source name:
World Development Indicators
Source organization:
UNESCO Institute for Statistics
Categories, topics:
Education, Gender
Last updated:
apr 23, 2017
Indicators value changes by year
Maximum:
54.676
jan 1, 2012
At the date of observation
Value
Absolute change
Change from previous value
jan 1, 1975
0.037
+0.037
0.0%
jan 1, 1976
0.074
+0.037
101.61%
jan 1, 1977
0.31
+0.236
318.94%
jan 1, 1978
0.101
-0.21
-67.58%
jan 1, 1979
0.09
-0.011
-10.47%
jan 1, 1980
0.343
+0.253
280.36%
jan 1, 1982
0.577
+0.234
68.34%
jan 1, 1983
0.955
+0.378
65.49%
jan 1, 1984
1.066
+0.111
11.64%
jan 1, 1985
1.025
-0.042
-3.9%
jan 1, 1986
1.723
+0.698
68.13%
jan 1, 1987
1.744
+0.021
1.22%
jan 1, 1988
2.582
+0.838
48.07%
jan 1, 1989
2.729
+0.147
5.71%
jan 1, 1990
2.953
+0.224
8.2%
jan 1, 1991
2.932
-0.021
-0.73%
jan 1, 1992
3.188
+0.256
8.73%
jan 1, 1993
3.727
+0.539
16.92%
jan 1, 1994
3.824
+0.097
2.61%
jan 1, 1995
4.101
+0.276
7.23%
jan 1, 1996
4.582
+0.481
11.74%
jan 1, 1997
4.697
+0.116
2.52%
jan 1, 1998
5.727
+1.029
21.91%
jan 1, 1999
6.141
+0.415
7.24%
jan 1, 2010
46.678
+40.537
660.06%
jan 1, 2012
54.676
+7.998
17.13%
jan 1, 2013
52.794
-1.882
-3.44%
jan 1, 2014
49.635
-3.159
-5.98%
jan 1, 2015
53.371
+3.736
7.53%
Ranking of countries by current statistics by years


Comments: