29
/
en
AIzaSyAYiBZKx7MnpbEhh9jyipgxe19OcubqV5w
April 1, 2024
225956
Portugal
PRT
true
2
1
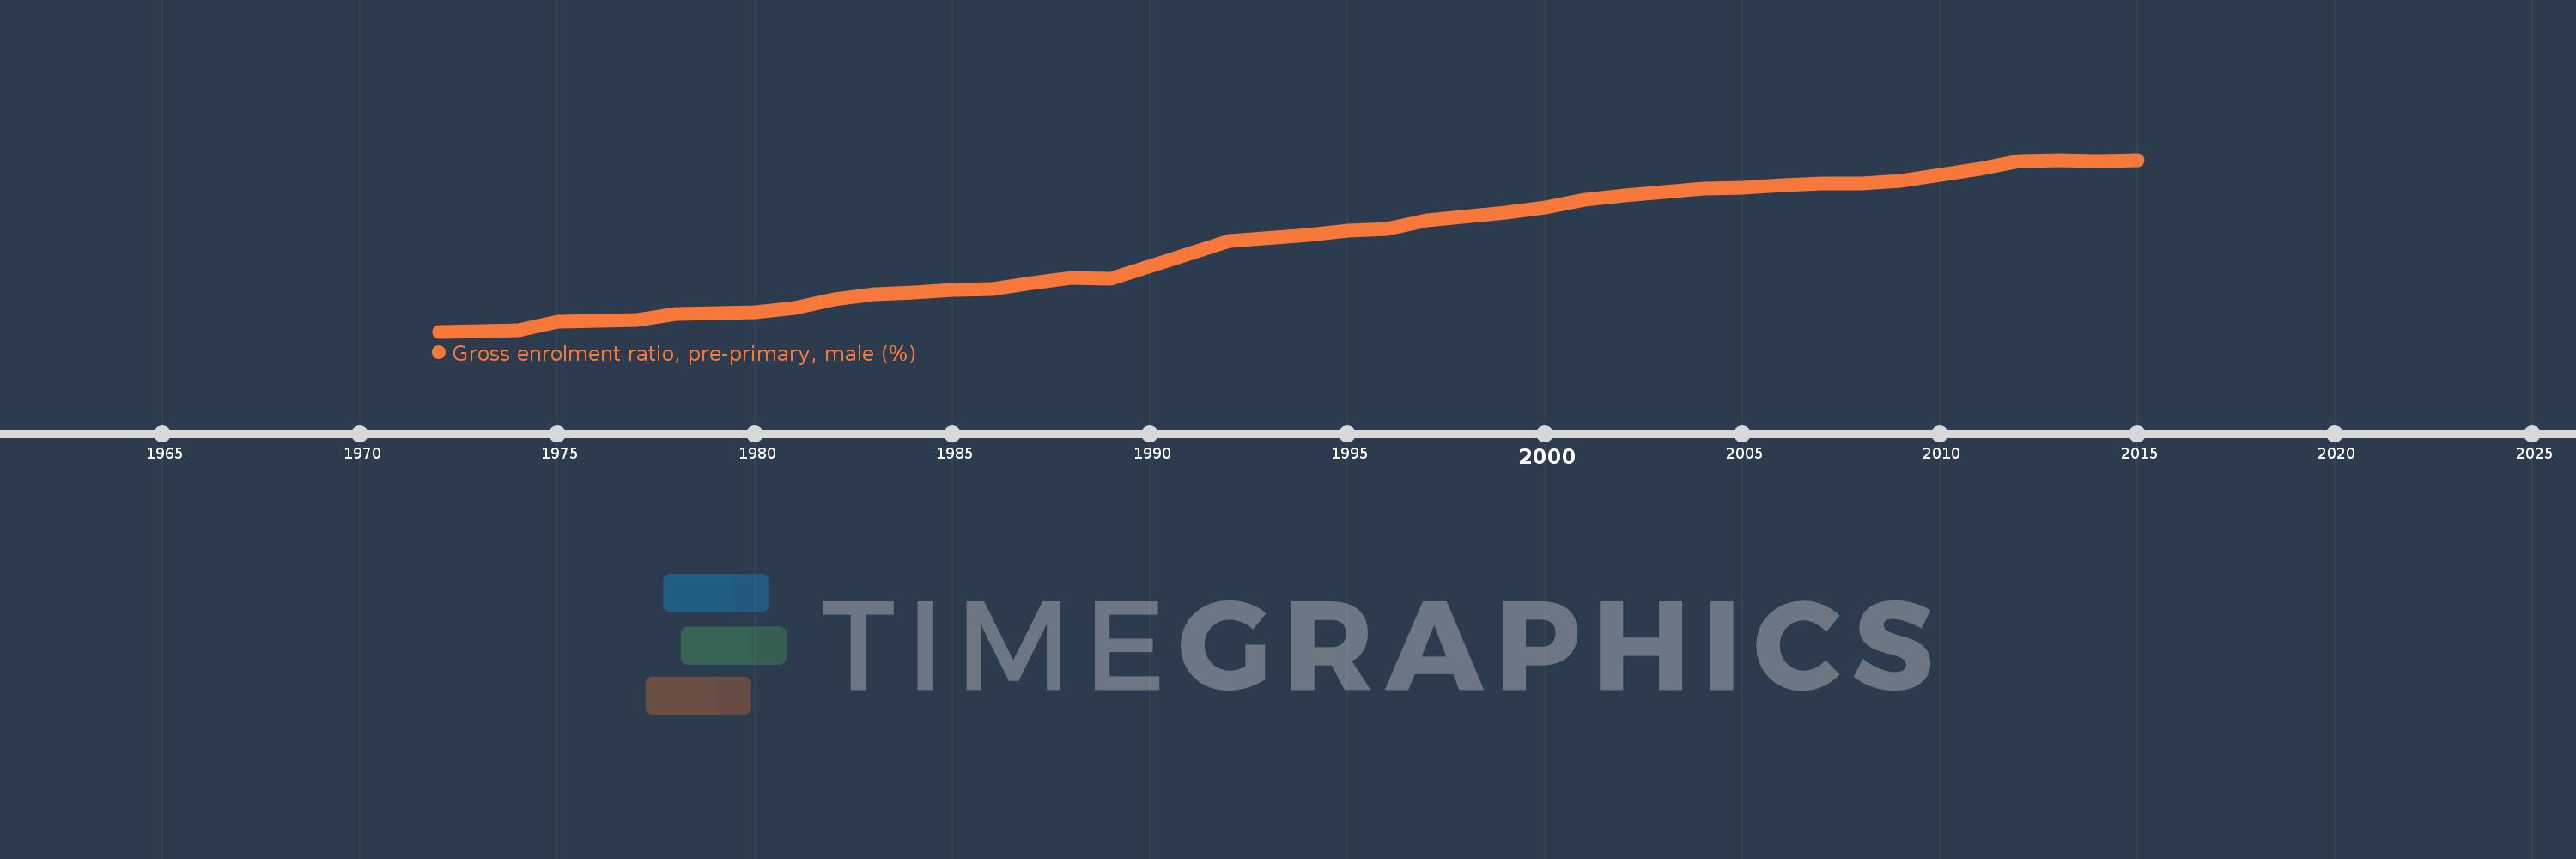
Gross enrolment ratio, pre-primary, male (%)
2015,2014,2013,2012,2011,2010,2009,2008,2007,2006,2005,2004,2002,2001,2000,1999,1997,1996,1995,1994,1992,1989,1988,1987,1986,1985,1984,1983,1982,1981,1980,1979,1978,1977,1976,1975,1974,1973,1972
This statistics in other country:
AfghanistanAlbaniaAlgeriaAndorraAngolaAntigua and BarbudaArab WorldArgentinaArmeniaArubaAustraliaAustriaAzerbaijanBahamas, TheBahrainBangladeshBarbadosBelarusBelgiumBelizeBeninBermudaBhutanBoliviaBosnia and HerzegovinaBotswanaBrazilBrunei DarussalamBulgariaBurkina FasoBurundiCabo VerdeCambodiaCameroonCanadaCaribbean small statesCentral African RepublicCentral Europe and the BalticsChadChileChinaColombiaComorosCongo, Dem. Rep.Congo, Rep.Costa RicaCote d'IvoireCroatiaCubaCyprusCzech RepublicDenmarkDjiboutiDominicaDominican RepublicEarly-demographic dividendEast Asia & PacificEast Asia & Pacific (excluding high income)East Asia & Pacific (IDA & IBRD countries)EcuadorEgypt, Arab Rep.El SalvadorEquatorial GuineaEritreaEstoniaEthiopiaEuro areaEurope & Central AsiaEurope & Central Asia (excluding high income)Europe & Central Asia (IDA & IBRD countries)European UnionFijiFinlandFragile and conflict affected situationsFranceGabonGambia, TheGeorgiaGermanyGhanaGreeceGrenadaGuatemalaGuineaGuinea-BissauGuyanaHeavily indebted poor countries (HIPC)High incomeHondurasHong Kong SAR, ChinaHungaryIBRD onlyIcelandIDA & IBRD totalIDA blendIDA onlyIDA totalIndiaIndonesiaIran, Islamic Rep.IraqIrelandIsraelItalyJamaicaJapanJordanKazakhstanKenyaKorea, Dem. People’s Rep.Korea, Rep.KuwaitKyrgyz RepublicLao PDRLate-demographic dividendLatin America & Caribbean Latin America & Caribbean (excluding high income)Latin America & the Caribbean (IDA & IBRD countries)LatviaLeast developed countries: UN classificationLebanonLesothoLiberiaLibyaLiechtensteinLithuaniaLow & middle incomeLow incomeLower middle incomeLuxembourgMacao SAR, ChinaMacedonia, FYRMadagascarMaldivesMaliMaltaMarshall IslandsMauritaniaMauritiusMexicoMicronesia, Fed. Sts.Middle East & North AfricaMiddle East & North Africa (excluding high income)Middle East & North Africa (IDA & IBRD countries)Middle incomeMoldovaMongoliaMontenegroMoroccoMozambiqueMyanmarNamibiaNauruNepalNetherlandsNew ZealandNicaraguaNigerNigeriaNorth AmericaNorwayOECD membersOmanOther small statesPacific island small statesPakistanPalauPanamaPapua New GuineaParaguayPeruPhilippinesPolandPortugalPost-demographic dividendPre-demographic dividendPuerto RicoQatarRomaniaRussian FederationRwandaSamoaSan MarinoSao Tome and PrincipeSaudi ArabiaSenegalSerbiaSeychellesSierra LeoneSlovak RepublicSloveniaSmall statesSolomon IslandsSomaliaSouth AfricaSouth AsiaSouth Asia (IDA & IBRD)South SudanSpainSri LankaSt. Kitts and NevisSt. LuciaSt. Vincent and the GrenadinesSub-Saharan Africa Sub-Saharan Africa (excluding high income)Sub-Saharan Africa (IDA & IBRD countries)SudanSurinameSwazilandSwedenSwitzerlandSyrian Arab RepublicTajikistanTanzaniaThailandTimor-LesteTogoTongaTrinidad and TobagoTunisiaTurkeyTurkmenistanTuvaluUgandaUkraineUnited Arab EmiratesUnited KingdomUnited StatesUpper middle incomeUruguayUzbekistanVanuatuVenezuela, RBVietnamWest Bank and GazaWorldYemen, Rep.Zimbabwe Timeline:
This timeline shows a graph from 1972 to 2015 of Portugal. No data until 1971. Number of actual observations by date: 39.
Source name:
World Development Indicators
Source organization:
UNESCO Institute for Statistics
Categories, topics:
Education, Gender
Last updated:
apr 23, 2017
Indicators value changes by year
Maximum:
93.273
jan 1, 2015
At the date of observation
Value
Absolute change
Change from previous value
jan 1, 1972
3.386
+3.386
0.0%
jan 1, 1973
3.717
+0.331
9.79%
jan 1, 1974
3.925
+0.208
5.58%
jan 1, 1975
8.601
+4.677
119.16%
jan 1, 1976
9.118
+0.517
6.01%
jan 1, 1977
9.413
+0.295
3.23%
jan 1, 1978
12.81
+3.397
36.09%
jan 1, 1979
13.109
+0.299
2.33%
jan 1, 1980
13.529
+0.42
3.2%
jan 1, 1981
15.948
+2.418
17.88%
jan 1, 1982
20.208
+4.26
26.71%
jan 1, 1983
23.096
+2.888
14.29%
jan 1, 1984
23.917
+0.822
3.56%
jan 1, 1985
25.282
+1.365
5.71%
jan 1, 1986
25.639
+0.356
1.41%
jan 1, 1987
28.917
+3.279
12.79%
jan 1, 1988
31.5
+2.583
8.93%
jan 1, 1989
30.856
-0.644
-2.04%
jan 1, 1992
50.835
+19.979
64.75%
jan 1, 1994
54.085
+3.25
6.39%
jan 1, 1995
56.296
+2.211
4.09%
jan 1, 1996
57.307
+1.011
1.8%
jan 1, 1997
61.388
+4.08
7.12%
jan 1, 1999
65.676
+4.288
6.99%
jan 1, 2000
68.456
+2.78
4.23%
jan 1, 2001
72.591
+4.134
6.04%
jan 1, 2002
74.809
+2.218
3.06%
jan 1, 2004
78.255
+3.446
4.61%
jan 1, 2005
78.814
+0.558
0.71%
jan 1, 2006
80.097
+1.284
1.63%
jan 1, 2007
80.989
+0.892
1.11%
jan 1, 2008
80.727
-0.262
-0.32%
jan 1, 2009
82.089
+1.362
1.69%
jan 1, 2010
85.566
+3.476
4.23%
jan 1, 2011
88.603
+3.037
3.55%
jan 1, 2012
92.377
+3.774
4.26%
jan 1, 2013
92.898
+0.521
0.56%
jan 1, 2014
92.453
-0.445
-0.48%
jan 1, 2015
93.273
+0.82
0.89%
Ranking of countries by current statistics by years


Comments: