29
/
en
AIzaSyAYiBZKx7MnpbEhh9jyipgxe19OcubqV5w
April 1, 2024
58131
South Asia (IDA & IBRD)
TSA
false
2
1
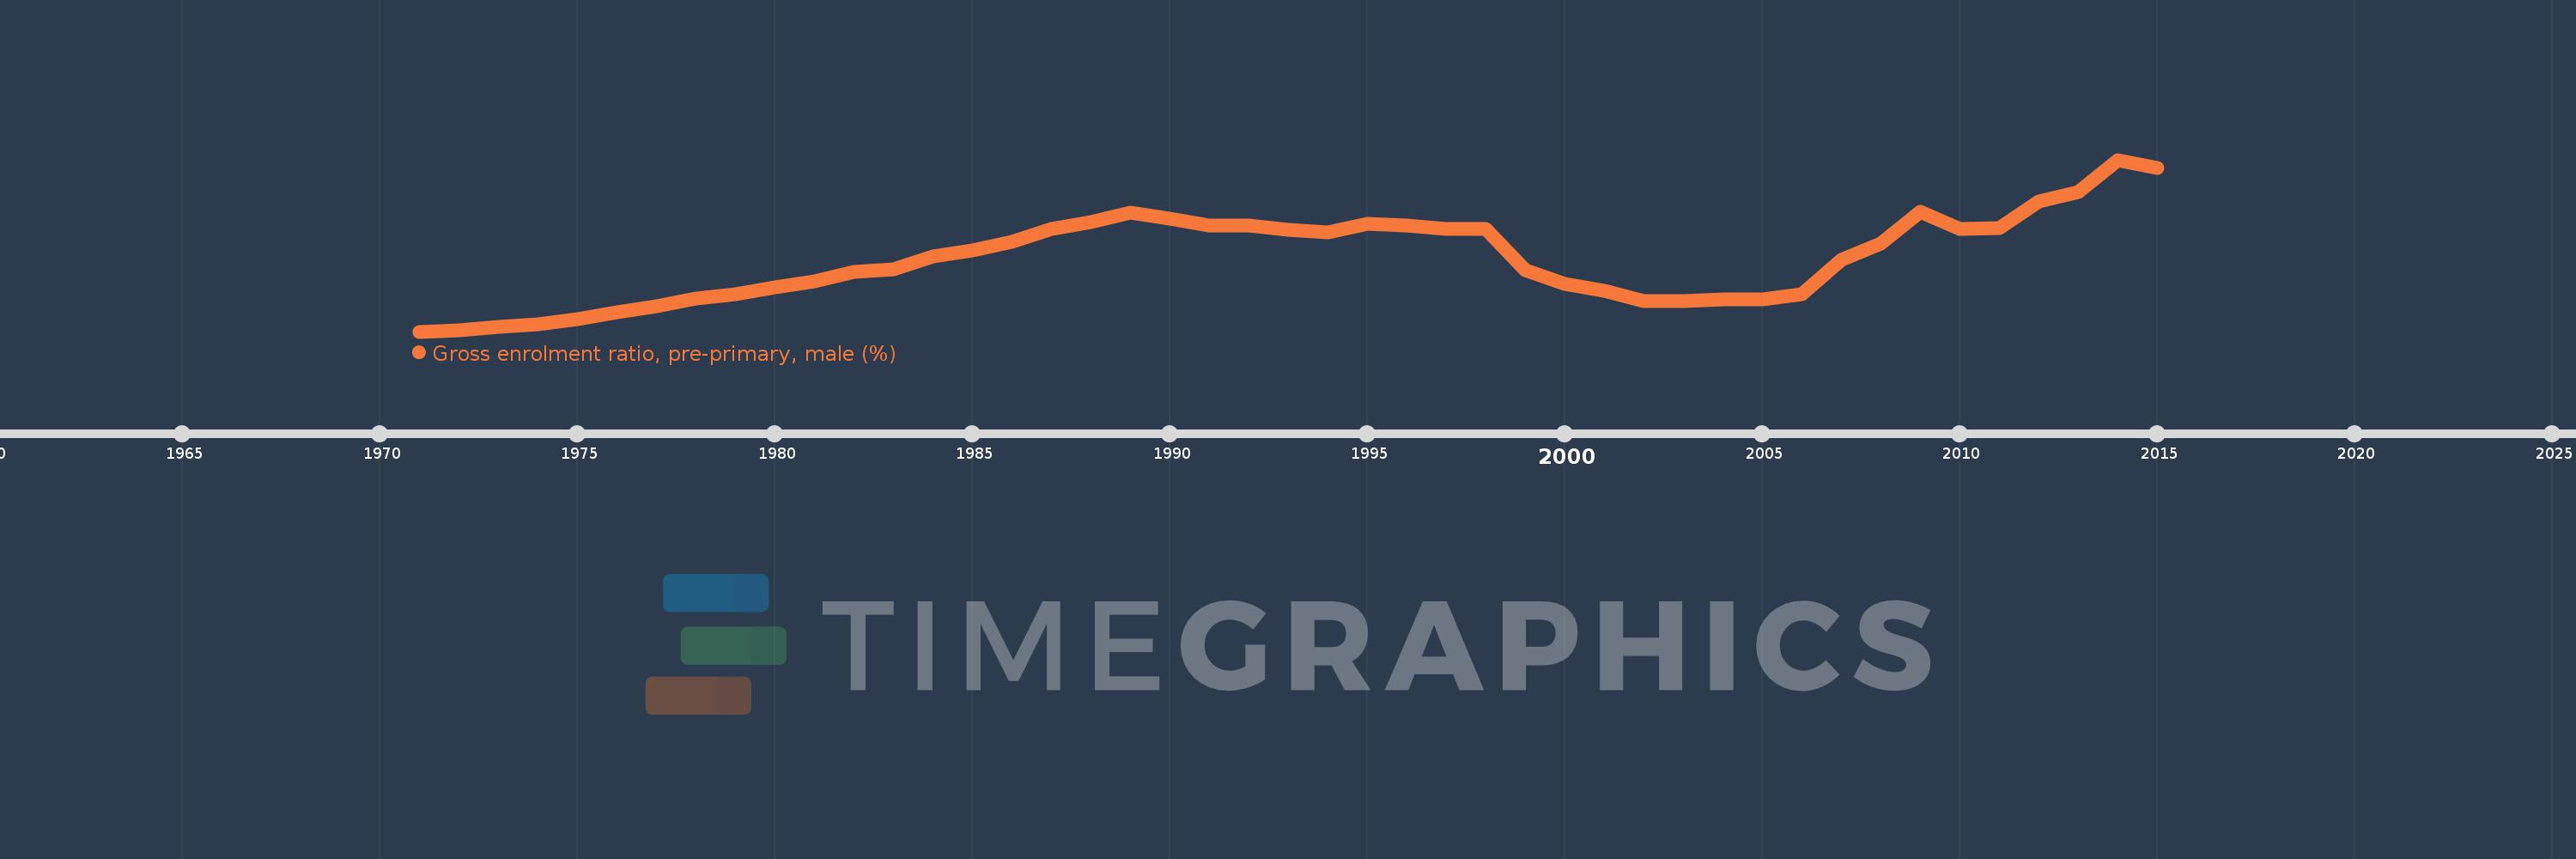
Gross enrolment ratio, pre-primary, male (%)
2015,2014,2013,2012,2011,2010,2009,2008,2007,2006,2005,2004,2003,2002,2001,2000,1999,1998,1997,1996,1995,1994,1993,1992,1991,1990,1989,1988,1987,1986,1985,1984,1983,1982,1981,1980,1979,1978,1977,1976,1975,1974,1973,1972,1971
This statistics in other country:
AfghanistanAlbaniaAlgeriaAndorraAngolaAntigua and BarbudaArab WorldArgentinaArmeniaArubaAustraliaAustriaAzerbaijanBahamas, TheBahrainBangladeshBarbadosBelarusBelgiumBelizeBeninBermudaBhutanBoliviaBosnia and HerzegovinaBotswanaBrazilBrunei DarussalamBulgariaBurkina FasoBurundiCabo VerdeCambodiaCameroonCanadaCaribbean small statesCentral African RepublicCentral Europe and the BalticsChadChileChinaColombiaComorosCongo, Dem. Rep.Congo, Rep.Costa RicaCote d'IvoireCroatiaCubaCyprusCzech RepublicDenmarkDjiboutiDominicaDominican RepublicEarly-demographic dividendEast Asia & PacificEast Asia & Pacific (excluding high income)East Asia & Pacific (IDA & IBRD countries)EcuadorEgypt, Arab Rep.El SalvadorEquatorial GuineaEritreaEstoniaEthiopiaEuro areaEurope & Central AsiaEurope & Central Asia (excluding high income)Europe & Central Asia (IDA & IBRD countries)European UnionFijiFinlandFragile and conflict affected situationsFranceGabonGambia, TheGeorgiaGermanyGhanaGreeceGrenadaGuatemalaGuineaGuinea-BissauGuyanaHeavily indebted poor countries (HIPC)High incomeHondurasHong Kong SAR, ChinaHungaryIBRD onlyIcelandIDA & IBRD totalIDA blendIDA onlyIDA totalIndiaIndonesiaIran, Islamic Rep.IraqIrelandIsraelItalyJamaicaJapanJordanKazakhstanKenyaKorea, Dem. People’s Rep.Korea, Rep.KuwaitKyrgyz RepublicLao PDRLate-demographic dividendLatin America & Caribbean Latin America & Caribbean (excluding high income)Latin America & the Caribbean (IDA & IBRD countries)LatviaLeast developed countries: UN classificationLebanonLesothoLiberiaLibyaLiechtensteinLithuaniaLow & middle incomeLow incomeLower middle incomeLuxembourgMacao SAR, ChinaMacedonia, FYRMadagascarMaldivesMaliMaltaMarshall IslandsMauritaniaMauritiusMexicoMicronesia, Fed. Sts.Middle East & North AfricaMiddle East & North Africa (excluding high income)Middle East & North Africa (IDA & IBRD countries)Middle incomeMoldovaMongoliaMontenegroMoroccoMozambiqueMyanmarNamibiaNauruNepalNetherlandsNew ZealandNicaraguaNigerNigeriaNorth AmericaNorwayOECD membersOmanOther small statesPacific island small statesPakistanPalauPanamaPapua New GuineaParaguayPeruPhilippinesPolandPortugalPost-demographic dividendPre-demographic dividendPuerto RicoQatarRomaniaRussian FederationRwandaSamoaSan MarinoSao Tome and PrincipeSaudi ArabiaSenegalSerbiaSeychellesSierra LeoneSlovak RepublicSloveniaSmall statesSolomon IslandsSomaliaSouth AfricaSouth AsiaSouth Asia (IDA & IBRD)South SudanSpainSri LankaSt. Kitts and NevisSt. LuciaSt. Vincent and the GrenadinesSub-Saharan Africa Sub-Saharan Africa (excluding high income)Sub-Saharan Africa (IDA & IBRD countries)SudanSurinameSwazilandSwedenSwitzerlandSyrian Arab RepublicTajikistanTanzaniaThailandTimor-LesteTogoTongaTrinidad and TobagoTunisiaTurkeyTurkmenistanTuvaluUgandaUkraineUnited Arab EmiratesUnited KingdomUnited StatesUpper middle incomeUruguayUzbekistanVanuatuVenezuela, RBVietnamWest Bank and GazaWorldYemen, Rep.Zimbabwe Timeline:
This timeline shows a graph from 1971 to 2015 of South Asia (IDA & IBRD). No data until 1970. Number of actual observations by date: 45.
Source name:
World Development Indicators
Source organization:
UNESCO Institute for Statistics
Categories, topics:
Education, Gender
Last updated:
apr 23, 2017
Indicators value changes by year
At the date of observation
Value
Absolute change
Change from previous value
jan 1, 1971
8.581
+8.581
0.0%
jan 1, 1972
8.671
+0.09
1.05%
jan 1, 1973
8.887
+0.216
2.49%
jan 1, 1974
9.021
+0.134
1.5%
jan 1, 1975
9.357
+0.336
3.73%
jan 1, 1976
9.764
+0.407
4.35%
jan 1, 1977
10.15
+0.385
3.94%
jan 1, 1978
10.614
+0.464
4.57%
jan 1, 1979
10.882
+0.268
2.53%
jan 1, 1980
11.311
+0.429
3.94%
jan 1, 1981
11.705
+0.394
3.48%
jan 1, 1982
12.276
+0.571
4.88%
jan 1, 1983
12.427
+0.151
1.23%
jan 1, 1984
13.272
+0.845
6.8%
jan 1, 1985
13.638
+0.366
2.76%
jan 1, 1986
14.17
+0.531
3.89%
jan 1, 1987
14.953
+0.784
5.53%
jan 1, 1988
15.394
+0.44
2.94%
jan 1, 1989
15.998
+0.604
3.93%
jan 1, 1990
15.622
-0.376
-2.35%
jan 1, 1991
15.149
-0.473
-3.03%
jan 1, 1992
15.2
+0.051
0.34%
jan 1, 1993
14.893
-0.307
-2.02%
jan 1, 1994
14.747
-0.145
-0.98%
jan 1, 1995
15.292
+0.544
3.69%
jan 1, 1996
15.187
-0.105
-0.68%
jan 1, 1997
14.965
-0.222
-1.46%
jan 1, 1998
14.946
-0.019
-0.13%
jan 1, 1999
12.401
-2.544
-17.02%
jan 1, 2000
11.558
-0.843
-6.8%
jan 1, 2001
11.115
-0.443
-3.83%
jan 1, 2002
10.49
-0.625
-5.62%
jan 1, 2003
10.488
-0.002
-0.02%
jan 1, 2004
10.603
+0.116
1.1%
jan 1, 2005
10.576
-0.028
-0.26%
jan 1, 2006
10.89
+0.314
2.97%
jan 1, 2007
13.041
+2.151
19.75%
jan 1, 2008
14.062
+1.021
7.83%
jan 1, 2009
16.041
+1.979
14.07%
jan 1, 2010
14.959
-1.082
-6.74%
jan 1, 2011
14.996
+0.037
0.25%
jan 1, 2012
16.665
+1.668
11.13%
jan 1, 2013
17.249
+0.585
3.51%
jan 1, 2014
19.26
+2.01
11.65%
jan 1, 2015
18.727
-0.533
-2.77%
Ranking of countries by current statistics by years


Comments: