29
/
en
AIzaSyAYiBZKx7MnpbEhh9jyipgxe19OcubqV5w
April 1, 2024
254177
Suriname
SUR
true
2
1
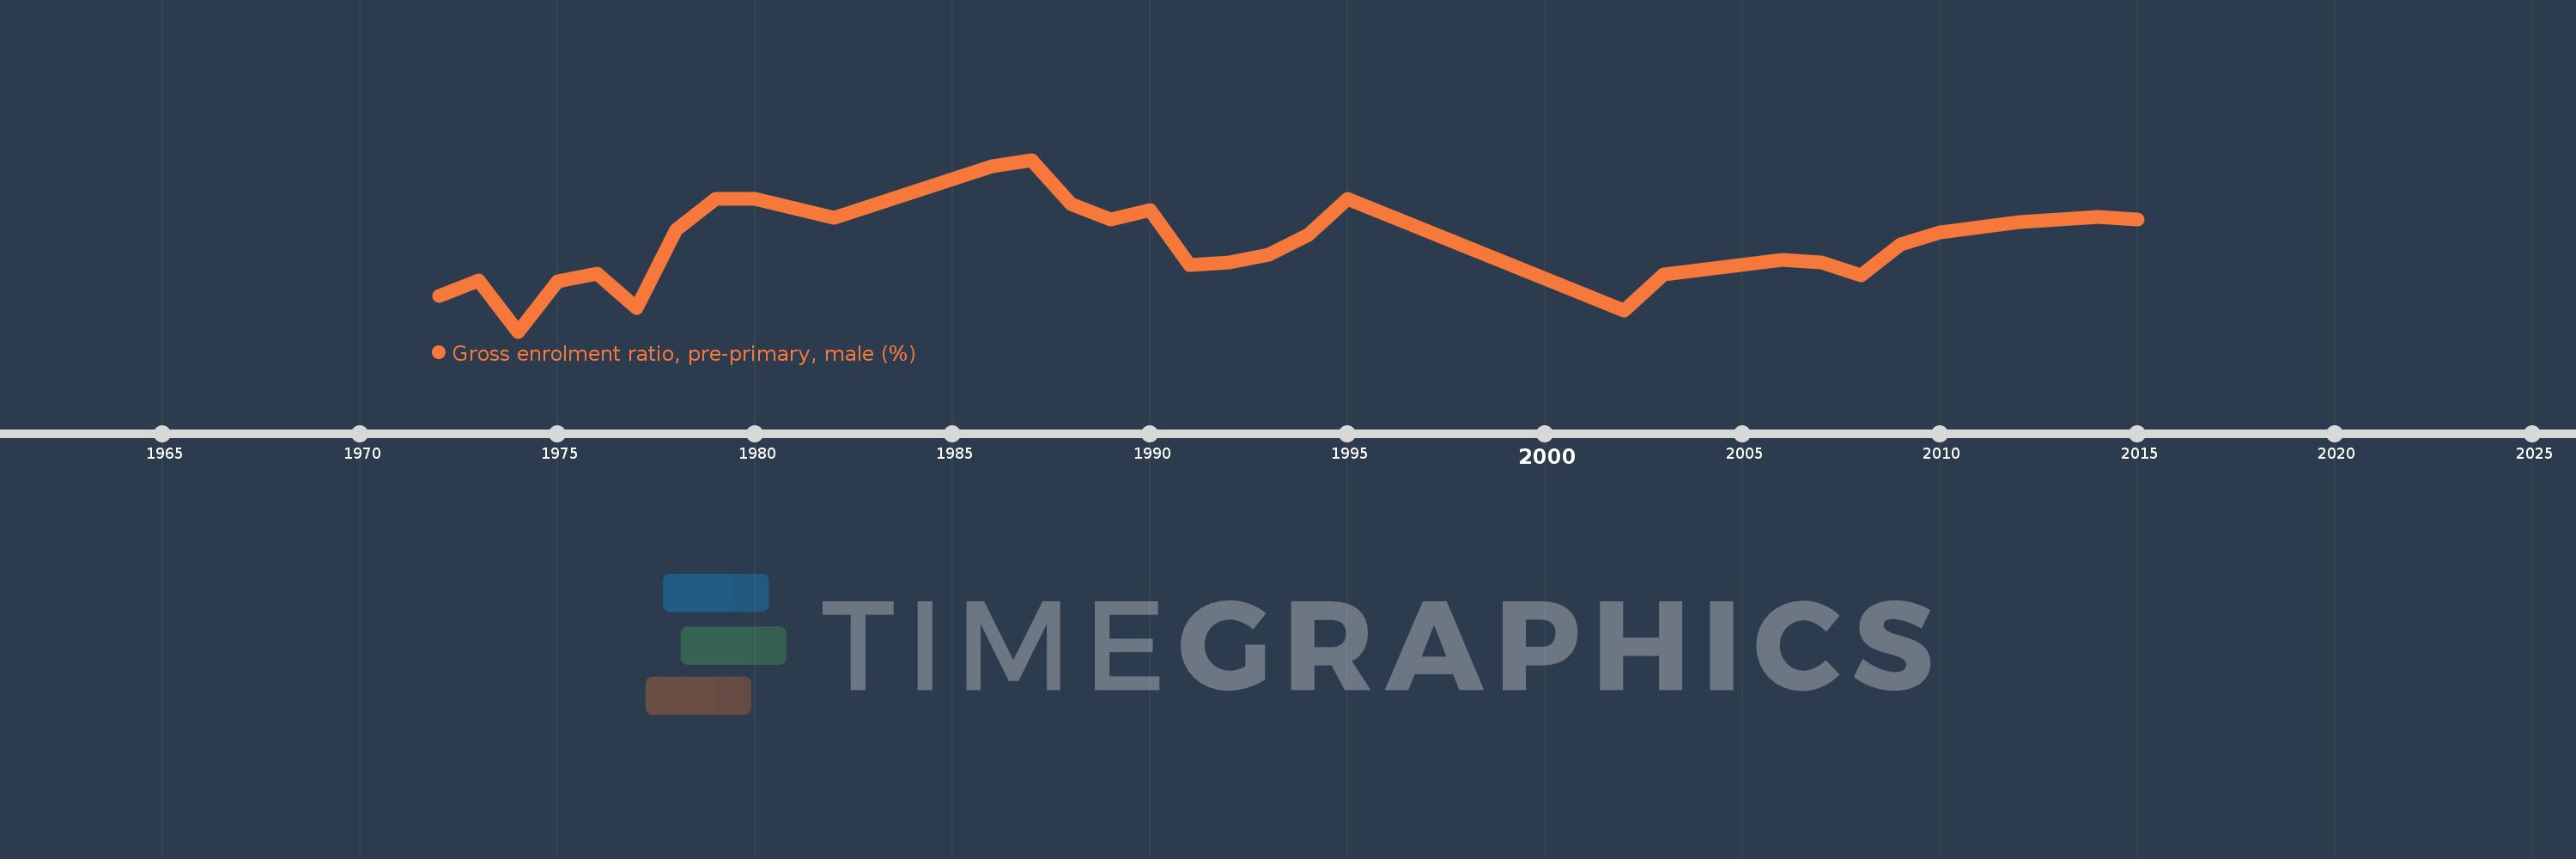
Gross enrolment ratio, pre-primary, male (%)
2015,2014,2012,2010,2009,2008,2007,2006,2003,2002,1995,1994,1993,1992,1991,1990,1989,1988,1987,1986,1982,1980,1979,1978,1977,1976,1975,1974,1973,1972
This statistics in other country:
AfghanistanAlbaniaAlgeriaAndorraAngolaAntigua and BarbudaArab WorldArgentinaArmeniaArubaAustraliaAustriaAzerbaijanBahamas, TheBahrainBangladeshBarbadosBelarusBelgiumBelizeBeninBermudaBhutanBoliviaBosnia and HerzegovinaBotswanaBrazilBrunei DarussalamBulgariaBurkina FasoBurundiCabo VerdeCambodiaCameroonCanadaCaribbean small statesCentral African RepublicCentral Europe and the BalticsChadChileChinaColombiaComorosCongo, Dem. Rep.Congo, Rep.Costa RicaCote d'IvoireCroatiaCubaCyprusCzech RepublicDenmarkDjiboutiDominicaDominican RepublicEarly-demographic dividendEast Asia & PacificEast Asia & Pacific (excluding high income)East Asia & Pacific (IDA & IBRD countries)EcuadorEgypt, Arab Rep.El SalvadorEquatorial GuineaEritreaEstoniaEthiopiaEuro areaEurope & Central AsiaEurope & Central Asia (excluding high income)Europe & Central Asia (IDA & IBRD countries)European UnionFijiFinlandFragile and conflict affected situationsFranceGabonGambia, TheGeorgiaGermanyGhanaGreeceGrenadaGuatemalaGuineaGuinea-BissauGuyanaHeavily indebted poor countries (HIPC)High incomeHondurasHong Kong SAR, ChinaHungaryIBRD onlyIcelandIDA & IBRD totalIDA blendIDA onlyIDA totalIndiaIndonesiaIran, Islamic Rep.IraqIrelandIsraelItalyJamaicaJapanJordanKazakhstanKenyaKorea, Dem. People’s Rep.Korea, Rep.KuwaitKyrgyz RepublicLao PDRLate-demographic dividendLatin America & Caribbean Latin America & Caribbean (excluding high income)Latin America & the Caribbean (IDA & IBRD countries)LatviaLeast developed countries: UN classificationLebanonLesothoLiberiaLibyaLiechtensteinLithuaniaLow & middle incomeLow incomeLower middle incomeLuxembourgMacao SAR, ChinaMacedonia, FYRMadagascarMaldivesMaliMaltaMarshall IslandsMauritaniaMauritiusMexicoMicronesia, Fed. Sts.Middle East & North AfricaMiddle East & North Africa (excluding high income)Middle East & North Africa (IDA & IBRD countries)Middle incomeMoldovaMongoliaMontenegroMoroccoMozambiqueMyanmarNamibiaNauruNepalNetherlandsNew ZealandNicaraguaNigerNigeriaNorth AmericaNorwayOECD membersOmanOther small statesPacific island small statesPakistanPalauPanamaPapua New GuineaParaguayPeruPhilippinesPolandPortugalPost-demographic dividendPre-demographic dividendPuerto RicoQatarRomaniaRussian FederationRwandaSamoaSan MarinoSao Tome and PrincipeSaudi ArabiaSenegalSerbiaSeychellesSierra LeoneSlovak RepublicSloveniaSmall statesSolomon IslandsSomaliaSouth AfricaSouth AsiaSouth Asia (IDA & IBRD)South SudanSpainSri LankaSt. Kitts and NevisSt. LuciaSt. Vincent and the GrenadinesSub-Saharan Africa Sub-Saharan Africa (excluding high income)Sub-Saharan Africa (IDA & IBRD countries)SudanSurinameSwazilandSwedenSwitzerlandSyrian Arab RepublicTajikistanTanzaniaThailandTimor-LesteTogoTongaTrinidad and TobagoTunisiaTurkeyTurkmenistanTuvaluUgandaUkraineUnited Arab EmiratesUnited KingdomUnited StatesUpper middle incomeUruguayUzbekistanVanuatuVenezuela, RBVietnamWest Bank and GazaWorldYemen, Rep.Zimbabwe Timeline:
This timeline shows a graph from 1972 to 2015 of Suriname. No data until 1971. Number of actual observations by date: 30.
Source name:
World Development Indicators
Source organization:
UNESCO Institute for Statistics
Categories, topics:
Education, Gender
Last updated:
apr 23, 2017
Indicators value changes by year
Minimum:
66.241
jan 1, 1974
Maximum:
105.412
jan 1, 1987
At the date of observation
Value
Absolute change
Change from previous value
jan 1, 1972
74.465
+74.465
0.0%
jan 1, 1973
77.966
+3.501
4.7%
jan 1, 1974
66.241
-11.725
-15.04%
jan 1, 1975
77.665
+11.424
17.25%
jan 1, 1976
79.397
+1.732
2.23%
jan 1, 1977
71.536
-7.861
-9.9%
jan 1, 1978
89.357
+17.821
24.91%
jan 1, 1979
96.451
+7.094
7.94%
jan 1, 1980
96.529
+0.079
0.08%
jan 1, 1982
92.272
-4.258
-4.41%
jan 1, 1986
103.923
+11.651
12.63%
jan 1, 1987
105.412
+1.489
1.43%
jan 1, 1988
95.295
-10.116
-9.6%
jan 1, 1989
91.714
-3.581
-3.76%
jan 1, 1990
94.038
+2.324
2.53%
jan 1, 1991
81.331
-12.706
-13.51%
jan 1, 1992
82.092
+0.761
0.94%
jan 1, 1993
83.781
+1.689
2.06%
jan 1, 1994
88.304
+4.522
5.4%
jan 1, 1995
96.563
+8.259
9.35%
jan 1, 2002
71.108
-25.455
-26.36%
jan 1, 2003
79.336
+8.228
11.57%
jan 1, 2006
82.609
+3.273
4.13%
jan 1, 2007
82.0
-0.609
-0.74%
jan 1, 2008
79.009
-2.991
-3.65%
jan 1, 2009
86.146
+7.136
9.03%
jan 1, 2010
88.877
+2.731
3.17%
jan 1, 2012
91.301
+2.425
2.73%
jan 1, 2014
92.329
+1.028
1.13%
jan 1, 2015
91.769
-0.56
-0.61%
Ranking of countries by current statistics by years


Comments: