29
/
en
AIzaSyAYiBZKx7MnpbEhh9jyipgxe19OcubqV5w
April 1, 2024
47167
Lower middle income
LMC
false
2
1
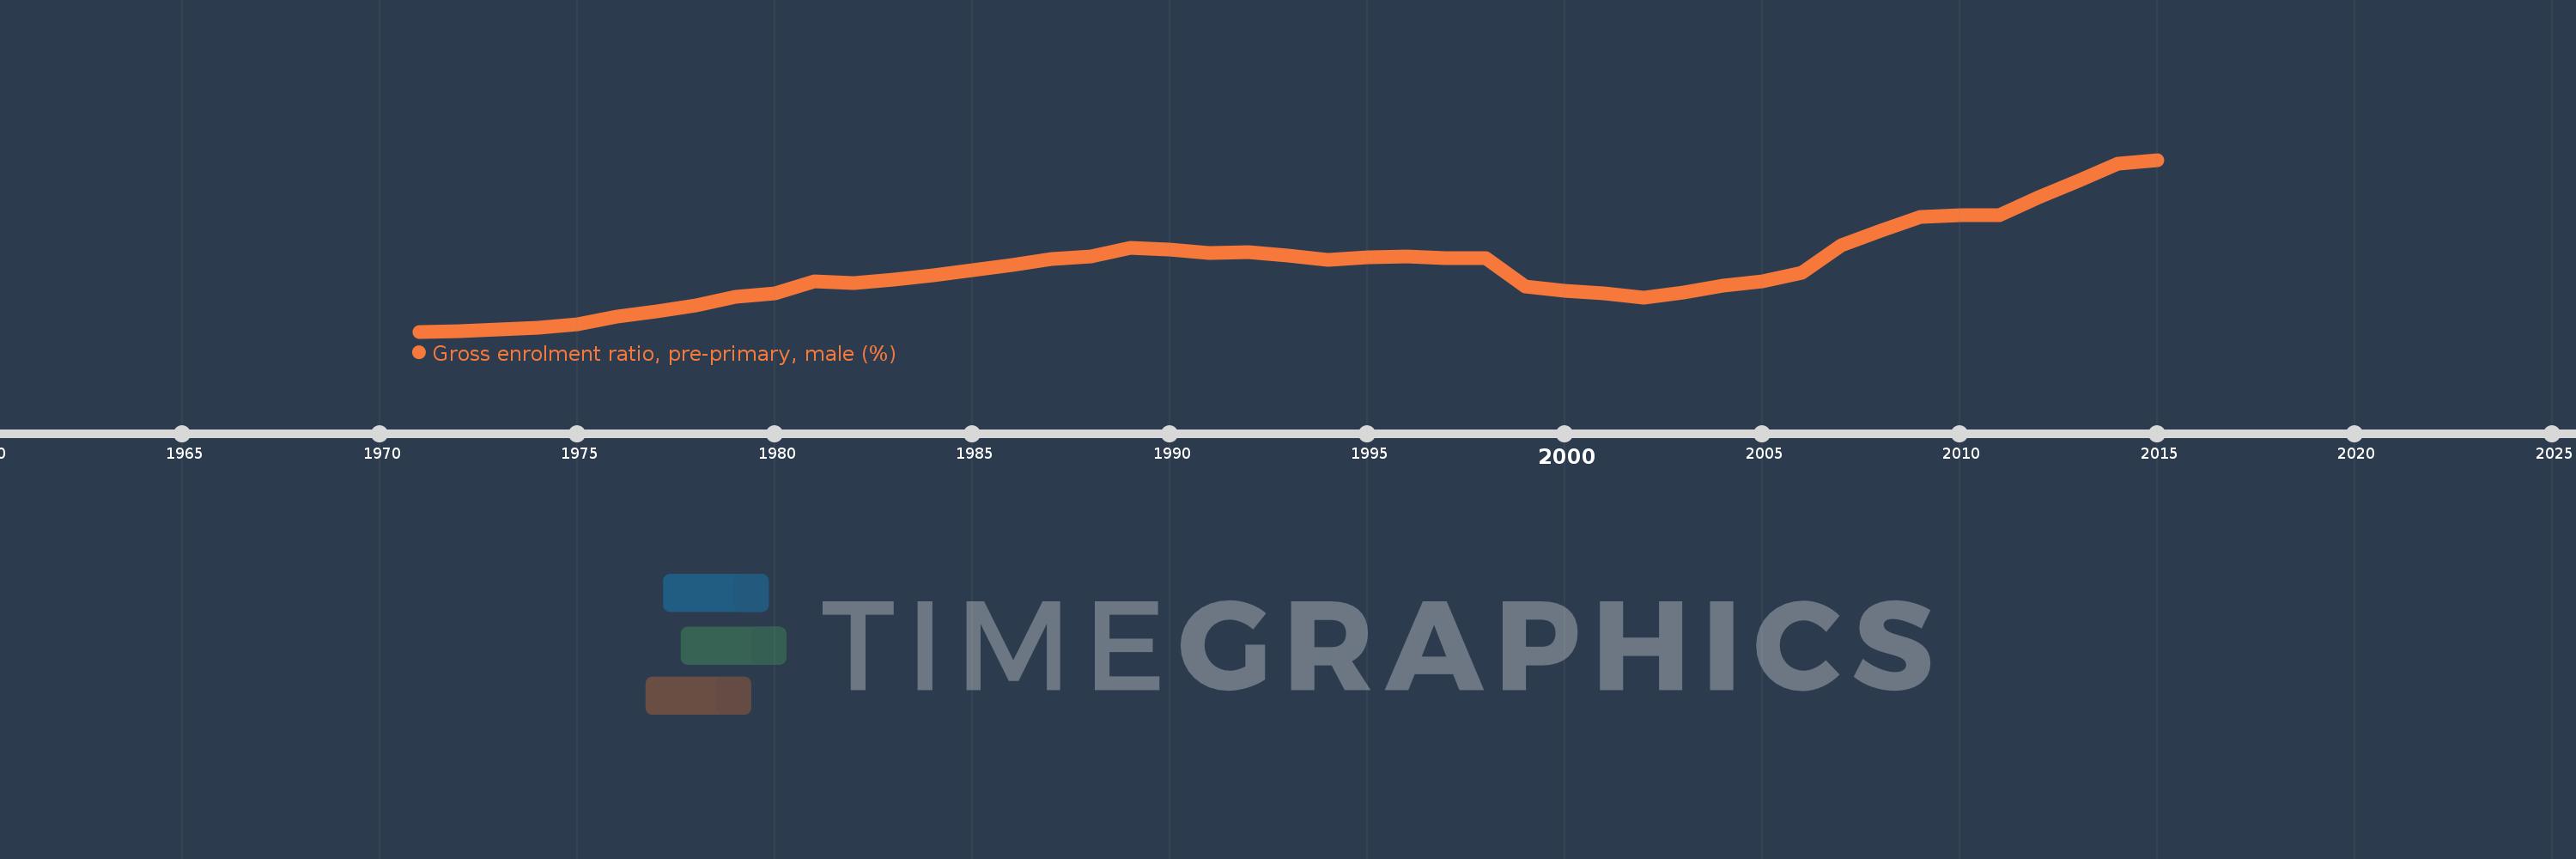
Gross enrolment ratio, pre-primary, male (%)
2015,2014,2013,2012,2011,2010,2009,2008,2007,2006,2005,2004,2003,2002,2001,2000,1999,1998,1997,1996,1995,1994,1993,1992,1991,1990,1989,1988,1987,1986,1985,1984,1983,1982,1981,1980,1979,1978,1977,1976,1975,1974,1973,1972,1971
This statistics in other country:
AfghanistanAlbaniaAlgeriaAndorraAngolaAntigua and BarbudaArab WorldArgentinaArmeniaArubaAustraliaAustriaAzerbaijanBahamas, TheBahrainBangladeshBarbadosBelarusBelgiumBelizeBeninBermudaBhutanBoliviaBosnia and HerzegovinaBotswanaBrazilBrunei DarussalamBulgariaBurkina FasoBurundiCabo VerdeCambodiaCameroonCanadaCaribbean small statesCentral African RepublicCentral Europe and the BalticsChadChileChinaColombiaComorosCongo, Dem. Rep.Congo, Rep.Costa RicaCote d'IvoireCroatiaCubaCyprusCzech RepublicDenmarkDjiboutiDominicaDominican RepublicEarly-demographic dividendEast Asia & PacificEast Asia & Pacific (excluding high income)East Asia & Pacific (IDA & IBRD countries)EcuadorEgypt, Arab Rep.El SalvadorEquatorial GuineaEritreaEstoniaEthiopiaEuro areaEurope & Central AsiaEurope & Central Asia (excluding high income)Europe & Central Asia (IDA & IBRD countries)European UnionFijiFinlandFragile and conflict affected situationsFranceGabonGambia, TheGeorgiaGermanyGhanaGreeceGrenadaGuatemalaGuineaGuinea-BissauGuyanaHeavily indebted poor countries (HIPC)High incomeHondurasHong Kong SAR, ChinaHungaryIBRD onlyIcelandIDA & IBRD totalIDA blendIDA onlyIDA totalIndiaIndonesiaIran, Islamic Rep.IraqIrelandIsraelItalyJamaicaJapanJordanKazakhstanKenyaKorea, Dem. People’s Rep.Korea, Rep.KuwaitKyrgyz RepublicLao PDRLate-demographic dividendLatin America & Caribbean Latin America & Caribbean (excluding high income)Latin America & the Caribbean (IDA & IBRD countries)LatviaLeast developed countries: UN classificationLebanonLesothoLiberiaLibyaLiechtensteinLithuaniaLow & middle incomeLow incomeLower middle incomeLuxembourgMacao SAR, ChinaMacedonia, FYRMadagascarMaldivesMaliMaltaMarshall IslandsMauritaniaMauritiusMexicoMicronesia, Fed. Sts.Middle East & North AfricaMiddle East & North Africa (excluding high income)Middle East & North Africa (IDA & IBRD countries)Middle incomeMoldovaMongoliaMontenegroMoroccoMozambiqueMyanmarNamibiaNauruNepalNetherlandsNew ZealandNicaraguaNigerNigeriaNorth AmericaNorwayOECD membersOmanOther small statesPacific island small statesPakistanPalauPanamaPapua New GuineaParaguayPeruPhilippinesPolandPortugalPost-demographic dividendPre-demographic dividendPuerto RicoQatarRomaniaRussian FederationRwandaSamoaSan MarinoSao Tome and PrincipeSaudi ArabiaSenegalSerbiaSeychellesSierra LeoneSlovak RepublicSloveniaSmall statesSolomon IslandsSomaliaSouth AfricaSouth AsiaSouth Asia (IDA & IBRD)South SudanSpainSri LankaSt. Kitts and NevisSt. LuciaSt. Vincent and the GrenadinesSub-Saharan Africa Sub-Saharan Africa (excluding high income)Sub-Saharan Africa (IDA & IBRD countries)SudanSurinameSwazilandSwedenSwitzerlandSyrian Arab RepublicTajikistanTanzaniaThailandTimor-LesteTogoTongaTrinidad and TobagoTunisiaTurkeyTurkmenistanTuvaluUgandaUkraineUnited Arab EmiratesUnited KingdomUnited StatesUpper middle incomeUruguayUzbekistanVanuatuVenezuela, RBVietnamWest Bank and GazaWorldYemen, Rep.Zimbabwe Timeline:
This timeline shows a graph from 1971 to 2015 of Lower middle income. No data until 1970. Number of actual observations by date: 45.
Source name:
World Development Indicators
Source organization:
UNESCO Institute for Statistics
Categories, topics:
Education, Gender
Last updated:
apr 23, 2017
Indicators value changes by year
Maximum:
26.502
jan 1, 2015
At the date of observation
Value
Absolute change
Change from previous value
jan 1, 1971
12.33
+12.33
0.0%
jan 1, 1972
12.382
+0.052
0.42%
jan 1, 1973
12.534
+0.152
1.23%
jan 1, 1974
12.684
+0.15
1.2%
jan 1, 1975
12.912
+0.228
1.8%
jan 1, 1976
13.602
+0.69
5.34%
jan 1, 1977
13.999
+0.397
2.92%
jan 1, 1978
14.513
+0.514
3.67%
jan 1, 1979
15.18
+0.667
4.6%
jan 1, 1980
15.517
+0.337
2.22%
jan 1, 1981
16.451
+0.934
6.02%
jan 1, 1982
16.358
-0.093
-0.57%
jan 1, 1983
16.613
+0.256
1.56%
jan 1, 1984
16.967
+0.354
2.13%
jan 1, 1985
17.421
+0.454
2.68%
jan 1, 1986
17.835
+0.414
2.38%
jan 1, 1987
18.333
+0.498
2.79%
jan 1, 1988
18.525
+0.191
1.04%
jan 1, 1989
19.269
+0.744
4.02%
jan 1, 1990
19.083
-0.186
-0.96%
jan 1, 1991
18.82
-0.263
-1.38%
jan 1, 1992
18.886
+0.066
0.35%
jan 1, 1993
18.603
-0.283
-1.5%
jan 1, 1994
18.239
-0.364
-1.96%
jan 1, 1995
18.476
+0.237
1.3%
jan 1, 1996
18.53
+0.054
0.29%
jan 1, 1997
18.387
-0.143
-0.77%
jan 1, 1998
18.374
-0.013
-0.07%
jan 1, 1999
16.022
-2.352
-12.8%
jan 1, 2000
15.707
-0.315
-1.97%
jan 1, 2001
15.454
-0.253
-1.61%
jan 1, 2002
15.096
-0.358
-2.32%
jan 1, 2003
15.577
+0.482
3.19%
jan 1, 2004
16.125
+0.548
3.52%
jan 1, 2005
16.497
+0.372
2.31%
jan 1, 2006
17.173
+0.675
4.09%
jan 1, 2007
19.471
+2.298
13.38%
jan 1, 2008
20.646
+1.175
6.03%
jan 1, 2009
21.785
+1.14
5.52%
jan 1, 2010
21.95
+0.165
0.76%
jan 1, 2011
21.947
-0.003
-0.01%
jan 1, 2012
23.394
+1.447
6.59%
jan 1, 2013
24.751
+1.358
5.8%
jan 1, 2014
26.161
+1.409
5.69%
jan 1, 2015
26.502
+0.341
1.3%
Ranking of countries by current statistics by years


Comments: