29
/
en
AIzaSyAYiBZKx7MnpbEhh9jyipgxe19OcubqV5w
April 1, 2024
50946
Middle income
MIC
false
2
1
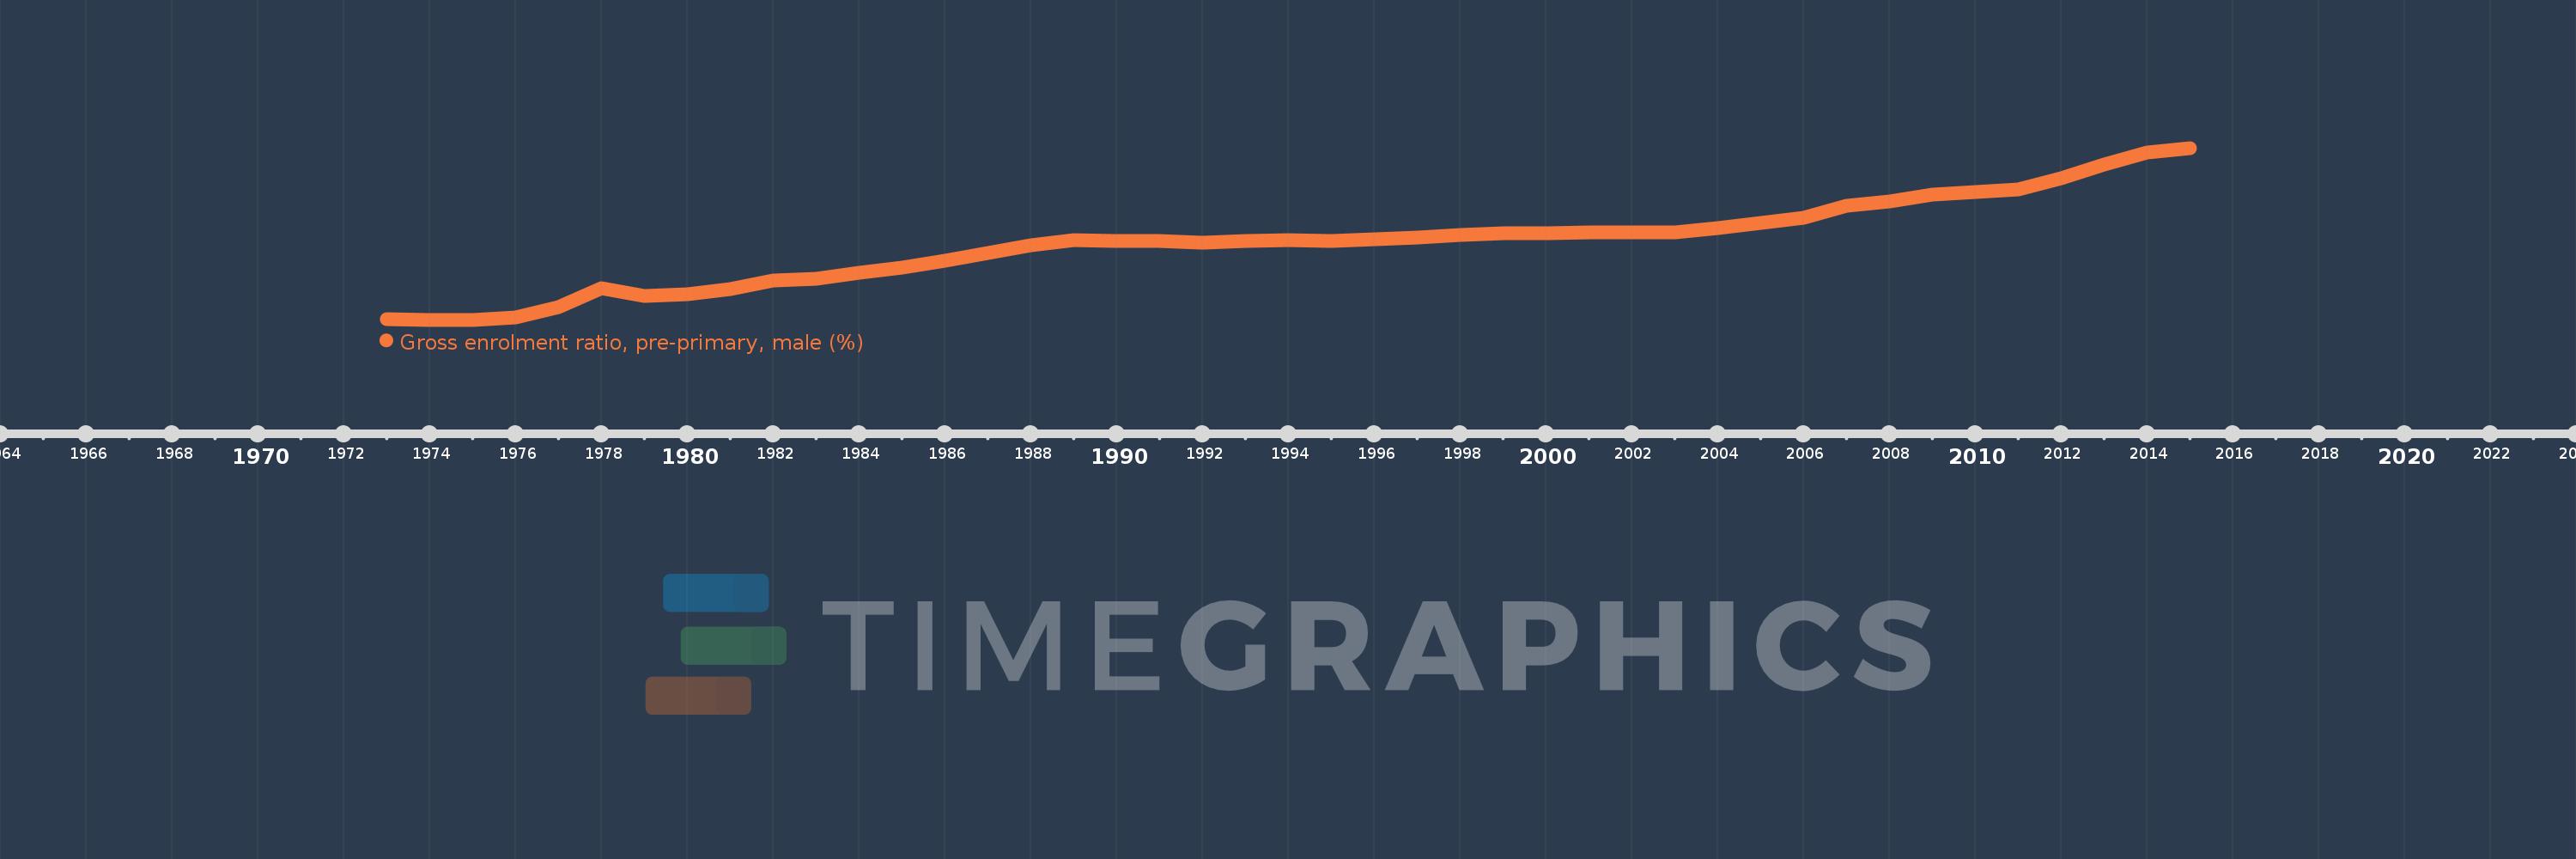
Gross enrolment ratio, pre-primary, male (%)
2015,2014,2013,2012,2011,2010,2009,2008,2007,2006,2005,2004,2003,2002,2001,2000,1999,1998,1997,1996,1995,1994,1993,1992,1991,1990,1989,1988,1987,1986,1985,1984,1983,1982,1981,1980,1979,1978,1977,1976,1975,1974,1973
This statistics in other country:
AfghanistanAlbaniaAlgeriaAndorraAngolaAntigua and BarbudaArab WorldArgentinaArmeniaArubaAustraliaAustriaAzerbaijanBahamas, TheBahrainBangladeshBarbadosBelarusBelgiumBelizeBeninBermudaBhutanBoliviaBosnia and HerzegovinaBotswanaBrazilBrunei DarussalamBulgariaBurkina FasoBurundiCabo VerdeCambodiaCameroonCanadaCaribbean small statesCentral African RepublicCentral Europe and the BalticsChadChileChinaColombiaComorosCongo, Dem. Rep.Congo, Rep.Costa RicaCote d'IvoireCroatiaCubaCyprusCzech RepublicDenmarkDjiboutiDominicaDominican RepublicEarly-demographic dividendEast Asia & PacificEast Asia & Pacific (excluding high income)East Asia & Pacific (IDA & IBRD countries)EcuadorEgypt, Arab Rep.El SalvadorEquatorial GuineaEritreaEstoniaEthiopiaEuro areaEurope & Central AsiaEurope & Central Asia (excluding high income)Europe & Central Asia (IDA & IBRD countries)European UnionFijiFinlandFragile and conflict affected situationsFranceGabonGambia, TheGeorgiaGermanyGhanaGreeceGrenadaGuatemalaGuineaGuinea-BissauGuyanaHeavily indebted poor countries (HIPC)High incomeHondurasHong Kong SAR, ChinaHungaryIBRD onlyIcelandIDA & IBRD totalIDA blendIDA onlyIDA totalIndiaIndonesiaIran, Islamic Rep.IraqIrelandIsraelItalyJamaicaJapanJordanKazakhstanKenyaKorea, Dem. People’s Rep.Korea, Rep.KuwaitKyrgyz RepublicLao PDRLate-demographic dividendLatin America & Caribbean Latin America & Caribbean (excluding high income)Latin America & the Caribbean (IDA & IBRD countries)LatviaLeast developed countries: UN classificationLebanonLesothoLiberiaLibyaLiechtensteinLithuaniaLow & middle incomeLow incomeLower middle incomeLuxembourgMacao SAR, ChinaMacedonia, FYRMadagascarMaldivesMaliMaltaMarshall IslandsMauritaniaMauritiusMexicoMicronesia, Fed. Sts.Middle East & North AfricaMiddle East & North Africa (excluding high income)Middle East & North Africa (IDA & IBRD countries)Middle incomeMoldovaMongoliaMontenegroMoroccoMozambiqueMyanmarNamibiaNauruNepalNetherlandsNew ZealandNicaraguaNigerNigeriaNorth AmericaNorwayOECD membersOmanOther small statesPacific island small statesPakistanPalauPanamaPapua New GuineaParaguayPeruPhilippinesPolandPortugalPost-demographic dividendPre-demographic dividendPuerto RicoQatarRomaniaRussian FederationRwandaSamoaSan MarinoSao Tome and PrincipeSaudi ArabiaSenegalSerbiaSeychellesSierra LeoneSlovak RepublicSloveniaSmall statesSolomon IslandsSomaliaSouth AfricaSouth AsiaSouth Asia (IDA & IBRD)South SudanSpainSri LankaSt. Kitts and NevisSt. LuciaSt. Vincent and the GrenadinesSub-Saharan Africa Sub-Saharan Africa (excluding high income)Sub-Saharan Africa (IDA & IBRD countries)SudanSurinameSwazilandSwedenSwitzerlandSyrian Arab RepublicTajikistanTanzaniaThailandTimor-LesteTogoTongaTrinidad and TobagoTunisiaTurkeyTurkmenistanTuvaluUgandaUkraineUnited Arab EmiratesUnited KingdomUnited StatesUpper middle incomeUruguayUzbekistanVanuatuVenezuela, RBVietnamWest Bank and GazaWorldYemen, Rep.Zimbabwe Timeline:
This timeline shows a graph from 1973 to 2015 of Middle income. No data until 1972. Number of actual observations by date: 43.
Source name:
World Development Indicators
Source organization:
UNESCO Institute for Statistics
Categories, topics:
Education, Gender
Last updated:
apr 23, 2017
Indicators value changes by year
Minimum:
10.318
jan 1, 1974
Maximum:
44.311
jan 1, 2015
At the date of observation
Value
Absolute change
Change from previous value
jan 1, 1973
10.396
+10.396
0.0%
jan 1, 1974
10.318
-0.078
-0.75%
jan 1, 1975
10.34
+0.023
0.22%
jan 1, 1976
10.805
+0.464
4.49%
jan 1, 1977
12.745
+1.94
17.95%
jan 1, 1978
16.592
+3.847
30.19%
jan 1, 1979
15.088
-1.504
-9.07%
jan 1, 1980
15.285
+0.197
1.31%
jan 1, 1981
16.463
+1.178
7.71%
jan 1, 1982
18.124
+1.661
10.09%
jan 1, 1983
18.504
+0.379
2.09%
jan 1, 1984
19.575
+1.071
5.79%
jan 1, 1985
20.619
+1.045
5.34%
jan 1, 1986
22.06
+1.44
6.98%
jan 1, 1987
23.552
+1.493
6.77%
jan 1, 1988
25.057
+1.504
6.39%
jan 1, 1989
26.037
+0.98
3.91%
jan 1, 1990
25.921
-0.116
-0.45%
jan 1, 1991
25.863
-0.058
-0.22%
jan 1, 1992
25.57
-0.293
-1.13%
jan 1, 1993
25.966
+0.396
1.55%
jan 1, 1994
26.071
+0.105
0.41%
jan 1, 1995
25.91
-0.161
-0.62%
jan 1, 1996
26.328
+0.418
1.61%
jan 1, 1997
26.664
+0.336
1.28%
jan 1, 1998
27.081
+0.417
1.56%
jan 1, 1999
27.491
+0.41
1.51%
jan 1, 2000
27.489
-0.002
-0.01%
jan 1, 2001
27.677
+0.188
0.68%
jan 1, 2002
27.652
-0.025
-0.09%
jan 1, 2003
27.572
-0.08
-0.29%
jan 1, 2004
28.517
+0.945
3.43%
jan 1, 2005
29.4
+0.883
3.1%
jan 1, 2006
30.513
+1.112
3.78%
jan 1, 2007
32.896
+2.383
7.81%
jan 1, 2008
33.701
+0.805
2.45%
jan 1, 2009
35.059
+1.358
4.03%
jan 1, 2010
35.599
+0.541
1.54%
jan 1, 2011
36.066
+0.467
1.31%
jan 1, 2012
38.368
+2.302
6.38%
jan 1, 2013
40.979
+2.611
6.81%
jan 1, 2014
43.406
+2.427
5.92%
jan 1, 2015
44.311
+0.905
2.09%
Ranking of countries by current statistics by years


Comments: