29
/
en
AIzaSyAYiBZKx7MnpbEhh9jyipgxe19OcubqV5w
April 1, 2024
140441
Ghana
GHA
true
2
1
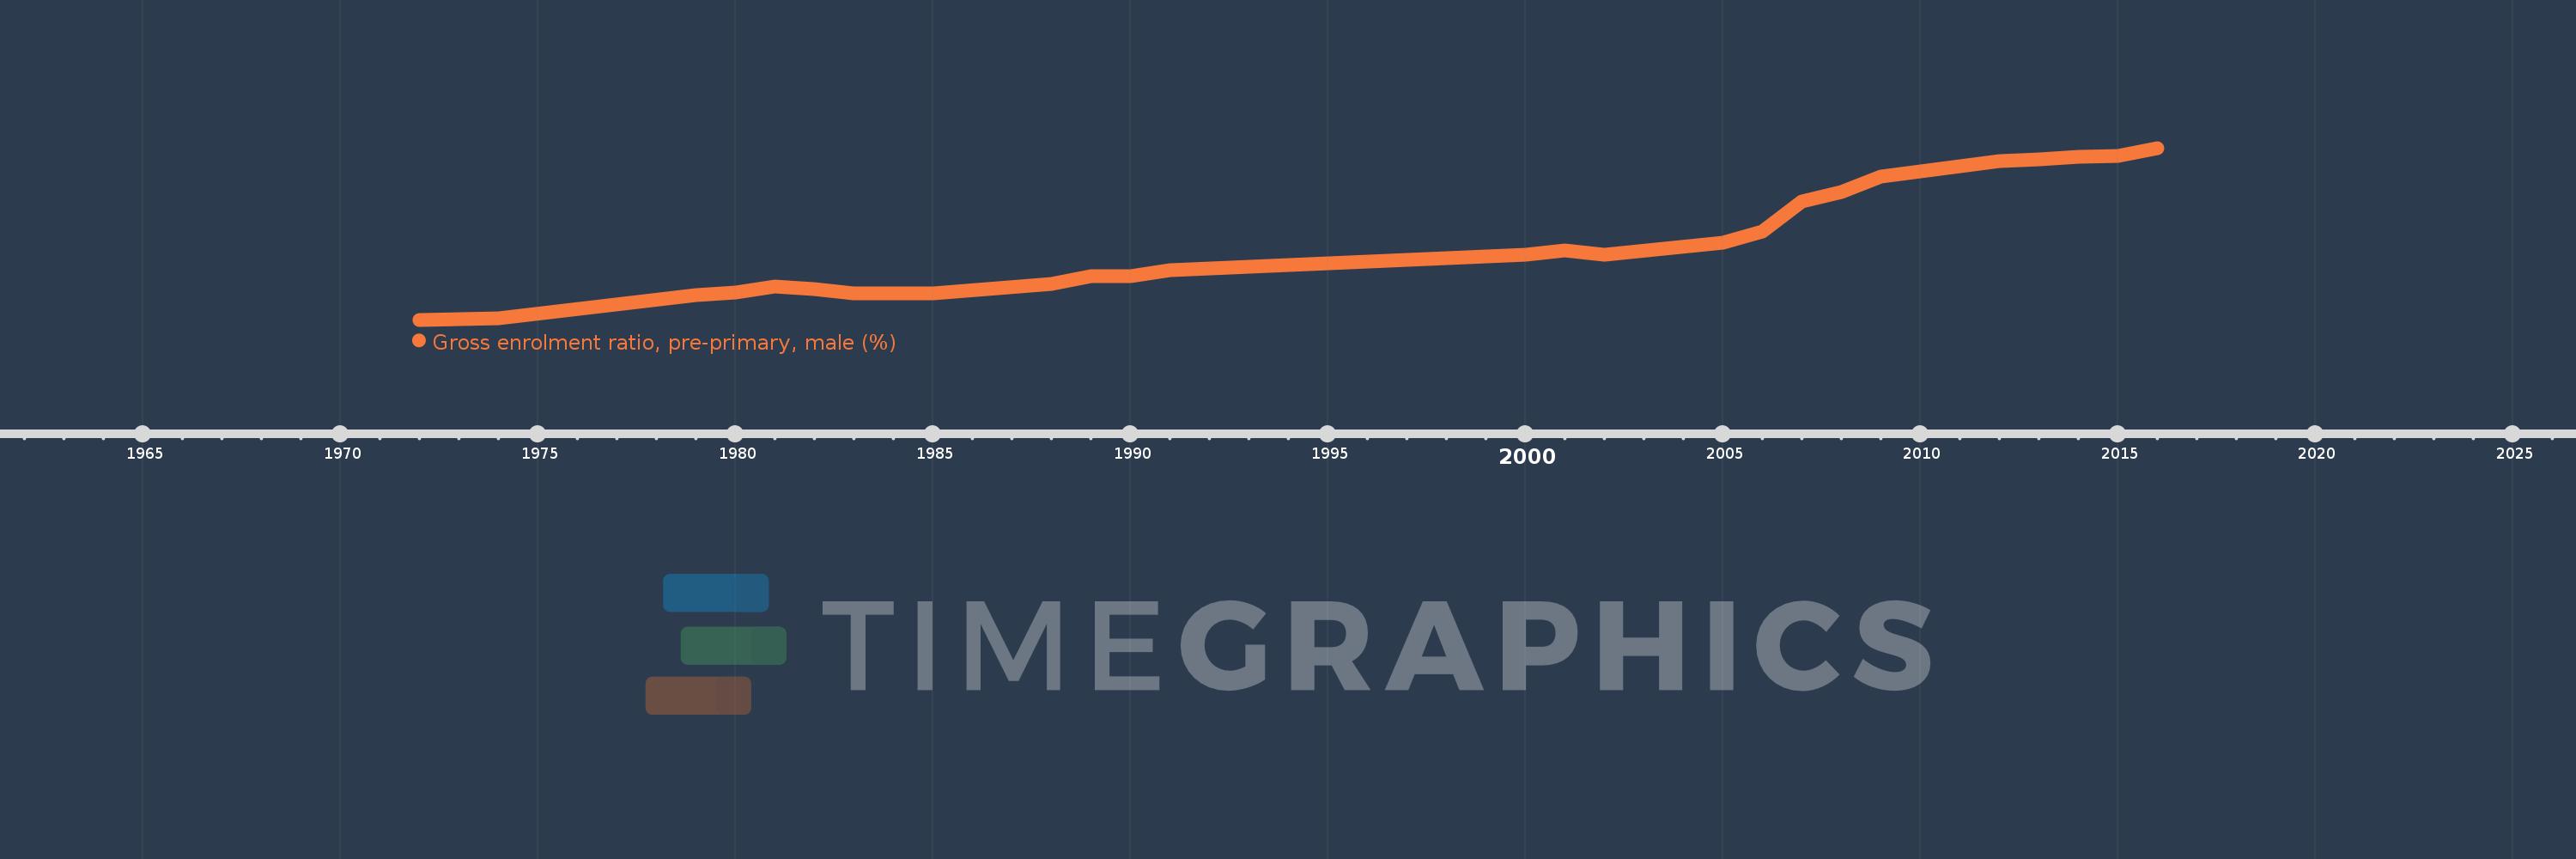
Gross enrolment ratio, pre-primary, male (%)
2016,2015,2014,2013,2012,2010,2009,2008,2007,2006,2005,2002,2001,2000,1991,1990,1989,1988,1985,1983,1982,1981,1980,1979,1974,1972
This statistics in other country:
AfghanistanAlbaniaAlgeriaAndorraAngolaAntigua and BarbudaArab WorldArgentinaArmeniaArubaAustraliaAustriaAzerbaijanBahamas, TheBahrainBangladeshBarbadosBelarusBelgiumBelizeBeninBermudaBhutanBoliviaBosnia and HerzegovinaBotswanaBrazilBrunei DarussalamBulgariaBurkina FasoBurundiCabo VerdeCambodiaCameroonCanadaCaribbean small statesCentral African RepublicCentral Europe and the BalticsChadChileChinaColombiaComorosCongo, Dem. Rep.Congo, Rep.Costa RicaCote d'IvoireCroatiaCubaCyprusCzech RepublicDenmarkDjiboutiDominicaDominican RepublicEarly-demographic dividendEast Asia & PacificEast Asia & Pacific (excluding high income)East Asia & Pacific (IDA & IBRD countries)EcuadorEgypt, Arab Rep.El SalvadorEquatorial GuineaEritreaEstoniaEthiopiaEuro areaEurope & Central AsiaEurope & Central Asia (excluding high income)Europe & Central Asia (IDA & IBRD countries)European UnionFijiFinlandFragile and conflict affected situationsFranceGabonGambia, TheGeorgiaGermanyGhanaGreeceGrenadaGuatemalaGuineaGuinea-BissauGuyanaHeavily indebted poor countries (HIPC)High incomeHondurasHong Kong SAR, ChinaHungaryIBRD onlyIcelandIDA & IBRD totalIDA blendIDA onlyIDA totalIndiaIndonesiaIran, Islamic Rep.IraqIrelandIsraelItalyJamaicaJapanJordanKazakhstanKenyaKorea, Dem. People’s Rep.Korea, Rep.KuwaitKyrgyz RepublicLao PDRLate-demographic dividendLatin America & Caribbean Latin America & Caribbean (excluding high income)Latin America & the Caribbean (IDA & IBRD countries)LatviaLeast developed countries: UN classificationLebanonLesothoLiberiaLibyaLiechtensteinLithuaniaLow & middle incomeLow incomeLower middle incomeLuxembourgMacao SAR, ChinaMacedonia, FYRMadagascarMaldivesMaliMaltaMarshall IslandsMauritaniaMauritiusMexicoMicronesia, Fed. Sts.Middle East & North AfricaMiddle East & North Africa (excluding high income)Middle East & North Africa (IDA & IBRD countries)Middle incomeMoldovaMongoliaMontenegroMoroccoMozambiqueMyanmarNamibiaNauruNepalNetherlandsNew ZealandNicaraguaNigerNigeriaNorth AmericaNorwayOECD membersOmanOther small statesPacific island small statesPakistanPalauPanamaPapua New GuineaParaguayPeruPhilippinesPolandPortugalPost-demographic dividendPre-demographic dividendPuerto RicoQatarRomaniaRussian FederationRwandaSamoaSan MarinoSao Tome and PrincipeSaudi ArabiaSenegalSerbiaSeychellesSierra LeoneSlovak RepublicSloveniaSmall statesSolomon IslandsSomaliaSouth AfricaSouth AsiaSouth Asia (IDA & IBRD)South SudanSpainSri LankaSt. Kitts and NevisSt. LuciaSt. Vincent and the GrenadinesSub-Saharan Africa Sub-Saharan Africa (excluding high income)Sub-Saharan Africa (IDA & IBRD countries)SudanSurinameSwazilandSwedenSwitzerlandSyrian Arab RepublicTajikistanTanzaniaThailandTimor-LesteTogoTongaTrinidad and TobagoTunisiaTurkeyTurkmenistanTuvaluUgandaUkraineUnited Arab EmiratesUnited KingdomUnited StatesUpper middle incomeUruguayUzbekistanVanuatuVenezuela, RBVietnamWest Bank and GazaWorldYemen, Rep.Zimbabwe Timeline:
This timeline shows a graph from 1972 to 2016 of Ghana. No data until 1971. Number of actual observations by date: 26.
Source name:
World Development Indicators
Source organization:
UNESCO Institute for Statistics
Categories, topics:
Education, Gender
Last updated:
apr 23, 2017
Indicators value changes by year
Maximum:
119.23
jan 1, 2016
At the date of observation
Value
Absolute change
Change from previous value
jan 1, 1972
3.195
+3.195
0.0%
jan 1, 1974
3.974
+0.779
24.38%
jan 1, 1979
19.983
+16.009
402.84%
jan 1, 1980
21.829
+1.846
9.24%
jan 1, 1981
25.915
+4.086
18.72%
jan 1, 1982
23.997
-1.917
-7.4%
jan 1, 1983
21.124
-2.873
-11.97%
jan 1, 1985
20.947
-0.176
-0.83%
jan 1, 1988
27.557
+6.61
31.55%
jan 1, 1989
32.824
+5.267
19.11%
jan 1, 1990
32.35
-0.474
-1.44%
jan 1, 1991
36.776
+4.426
13.68%
jan 1, 2000
46.935
+10.159
27.62%
jan 1, 2001
50.073
+3.137
6.68%
jan 1, 2002
47.238
-2.835
-5.66%
jan 1, 2005
55.256
+8.018
16.97%
jan 1, 2006
62.601
+7.345
13.29%
jan 1, 2007
82.935
+20.334
32.48%
jan 1, 2008
89.656
+6.722
8.1%
jan 1, 2009
99.743
+10.086
11.25%
jan 1, 2010
103.107
+3.364
3.37%
jan 1, 2012
110.274
+7.168
6.95%
jan 1, 2013
111.575
+1.3
1.18%
jan 1, 2014
113.332
+1.757
1.58%
jan 1, 2015
113.721
+0.389
0.34%
jan 1, 2016
119.23
+5.509
4.84%
Ranking of countries by current statistics by years


Comments: