29
/
en
AIzaSyAYiBZKx7MnpbEhh9jyipgxe19OcubqV5w
April 1, 2024
53446
Other small states
OSS
false
2
1
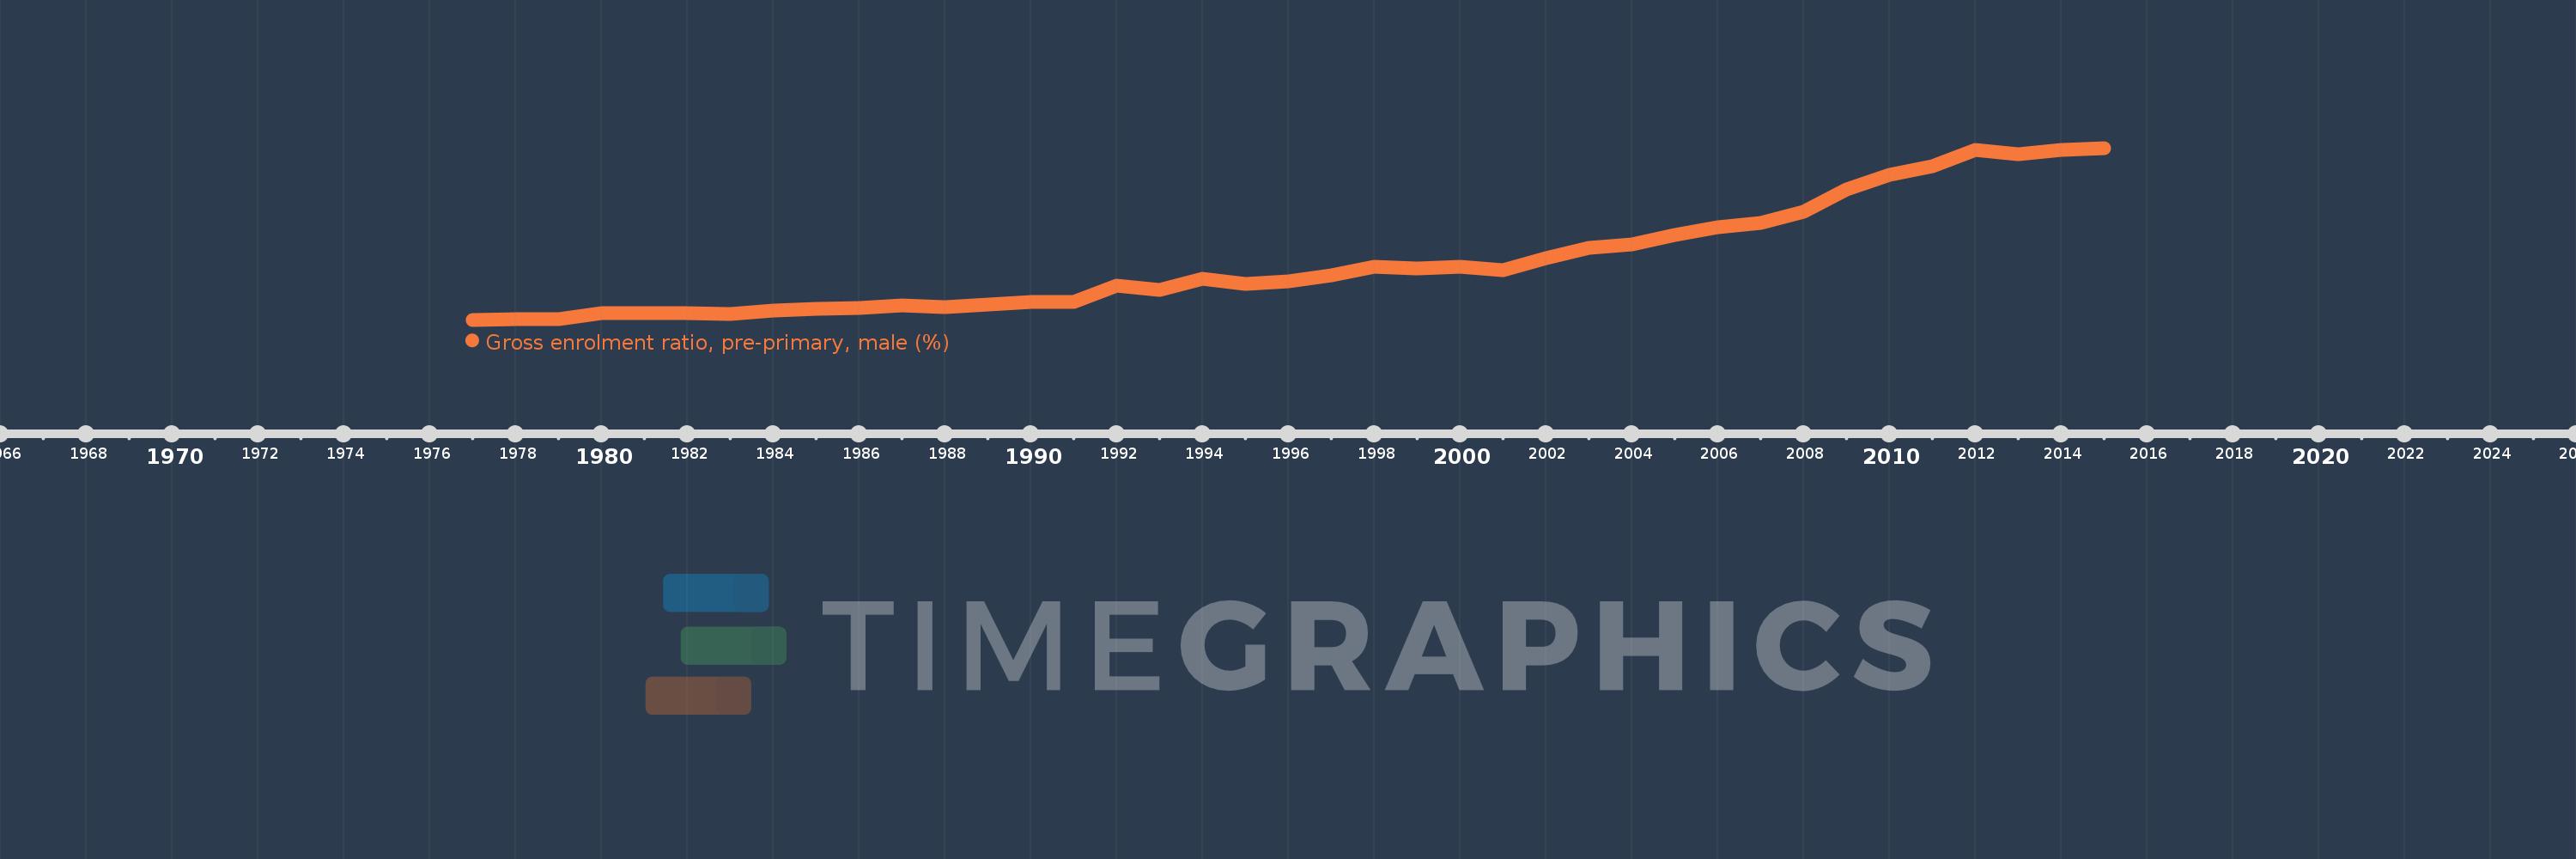
Gross enrolment ratio, pre-primary, male (%)
2015,2014,2013,2012,2011,2010,2009,2008,2007,2006,2005,2004,2003,2002,2001,2000,1999,1998,1997,1996,1995,1994,1993,1992,1991,1990,1989,1988,1987,1986,1985,1984,1983,1982,1981,1980,1979,1978,1977
This statistics in other country:
AfghanistanAlbaniaAlgeriaAndorraAngolaAntigua and BarbudaArab WorldArgentinaArmeniaArubaAustraliaAustriaAzerbaijanBahamas, TheBahrainBangladeshBarbadosBelarusBelgiumBelizeBeninBermudaBhutanBoliviaBosnia and HerzegovinaBotswanaBrazilBrunei DarussalamBulgariaBurkina FasoBurundiCabo VerdeCambodiaCameroonCanadaCaribbean small statesCentral African RepublicCentral Europe and the BalticsChadChileChinaColombiaComorosCongo, Dem. Rep.Congo, Rep.Costa RicaCote d'IvoireCroatiaCubaCyprusCzech RepublicDenmarkDjiboutiDominicaDominican RepublicEarly-demographic dividendEast Asia & PacificEast Asia & Pacific (excluding high income)East Asia & Pacific (IDA & IBRD countries)EcuadorEgypt, Arab Rep.El SalvadorEquatorial GuineaEritreaEstoniaEthiopiaEuro areaEurope & Central AsiaEurope & Central Asia (excluding high income)Europe & Central Asia (IDA & IBRD countries)European UnionFijiFinlandFragile and conflict affected situationsFranceGabonGambia, TheGeorgiaGermanyGhanaGreeceGrenadaGuatemalaGuineaGuinea-BissauGuyanaHeavily indebted poor countries (HIPC)High incomeHondurasHong Kong SAR, ChinaHungaryIBRD onlyIcelandIDA & IBRD totalIDA blendIDA onlyIDA totalIndiaIndonesiaIran, Islamic Rep.IraqIrelandIsraelItalyJamaicaJapanJordanKazakhstanKenyaKorea, Dem. People’s Rep.Korea, Rep.KuwaitKyrgyz RepublicLao PDRLate-demographic dividendLatin America & Caribbean Latin America & Caribbean (excluding high income)Latin America & the Caribbean (IDA & IBRD countries)LatviaLeast developed countries: UN classificationLebanonLesothoLiberiaLibyaLiechtensteinLithuaniaLow & middle incomeLow incomeLower middle incomeLuxembourgMacao SAR, ChinaMacedonia, FYRMadagascarMaldivesMaliMaltaMarshall IslandsMauritaniaMauritiusMexicoMicronesia, Fed. Sts.Middle East & North AfricaMiddle East & North Africa (excluding high income)Middle East & North Africa (IDA & IBRD countries)Middle incomeMoldovaMongoliaMontenegroMoroccoMozambiqueMyanmarNamibiaNauruNepalNetherlandsNew ZealandNicaraguaNigerNigeriaNorth AmericaNorwayOECD membersOmanOther small statesPacific island small statesPakistanPalauPanamaPapua New GuineaParaguayPeruPhilippinesPolandPortugalPost-demographic dividendPre-demographic dividendPuerto RicoQatarRomaniaRussian FederationRwandaSamoaSan MarinoSao Tome and PrincipeSaudi ArabiaSenegalSerbiaSeychellesSierra LeoneSlovak RepublicSloveniaSmall statesSolomon IslandsSomaliaSouth AfricaSouth AsiaSouth Asia (IDA & IBRD)South SudanSpainSri LankaSt. Kitts and NevisSt. LuciaSt. Vincent and the GrenadinesSub-Saharan Africa Sub-Saharan Africa (excluding high income)Sub-Saharan Africa (IDA & IBRD countries)SudanSurinameSwazilandSwedenSwitzerlandSyrian Arab RepublicTajikistanTanzaniaThailandTimor-LesteTogoTongaTrinidad and TobagoTunisiaTurkeyTurkmenistanTuvaluUgandaUkraineUnited Arab EmiratesUnited KingdomUnited StatesUpper middle incomeUruguayUzbekistanVanuatuVenezuela, RBVietnamWest Bank and GazaWorldYemen, Rep.Zimbabwe Timeline:
This timeline shows a graph from 1977 to 2015 of Other small states. No data until 1976. Number of actual observations by date: 39.
Source name:
World Development Indicators
Source organization:
UNESCO Institute for Statistics
Categories, topics:
Education, Gender
Last updated:
apr 23, 2017
Indicators value changes by year
Minimum:
22.042
jan 1, 1977
Maximum:
36.445
jan 1, 2015
At the date of observation
Value
Absolute change
Change from previous value
jan 1, 1977
22.042
+22.042
0.0%
jan 1, 1978
22.078
+0.036
0.16%
jan 1, 1979
22.113
+0.035
0.16%
jan 1, 1980
22.588
+0.475
2.15%
jan 1, 1981
22.618
+0.03
0.13%
jan 1, 1982
22.587
-0.031
-0.14%
jan 1, 1983
22.522
-0.065
-0.29%
jan 1, 1984
22.802
+0.28
1.24%
jan 1, 1985
22.935
+0.133
0.58%
jan 1, 1986
23.027
+0.092
0.4%
jan 1, 1987
23.237
+0.211
0.91%
jan 1, 1988
23.101
-0.136
-0.59%
jan 1, 1989
23.336
+0.235
1.02%
jan 1, 1990
23.515
+0.179
0.77%
jan 1, 1991
23.56
+0.045
0.19%
jan 1, 1992
24.933
+1.372
5.82%
jan 1, 1993
24.557
-0.375
-1.51%
jan 1, 1994
25.458
+0.901
3.67%
jan 1, 1995
25.025
-0.433
-1.7%
jan 1, 1996
25.284
+0.259
1.04%
jan 1, 1997
25.757
+0.472
1.87%
jan 1, 1998
26.464
+0.708
2.75%
jan 1, 1999
26.374
-0.09
-0.34%
jan 1, 2000
26.506
+0.132
0.5%
jan 1, 2001
26.181
-0.325
-1.22%
jan 1, 2002
27.235
+1.053
4.02%
jan 1, 2003
28.035
+0.8
2.94%
jan 1, 2004
28.351
+0.317
1.13%
jan 1, 2005
29.14
+0.789
2.78%
jan 1, 2006
29.812
+0.672
2.31%
jan 1, 2007
30.192
+0.38
1.27%
jan 1, 2008
31.111
+0.919
3.04%
jan 1, 2009
32.97
+1.859
5.98%
jan 1, 2010
34.179
+1.209
3.67%
jan 1, 2011
34.929
+0.75
2.19%
jan 1, 2012
36.271
+1.341
3.84%
jan 1, 2013
35.951
-0.32
-0.88%
jan 1, 2014
36.293
+0.343
0.95%
jan 1, 2015
36.445
+0.152
0.42%
Ranking of countries by current statistics by years


Comments: