29
/
en
AIzaSyAYiBZKx7MnpbEhh9jyipgxe19OcubqV5w
April 1, 2024
281030
Venezuela, RB
VEN
true
2
1
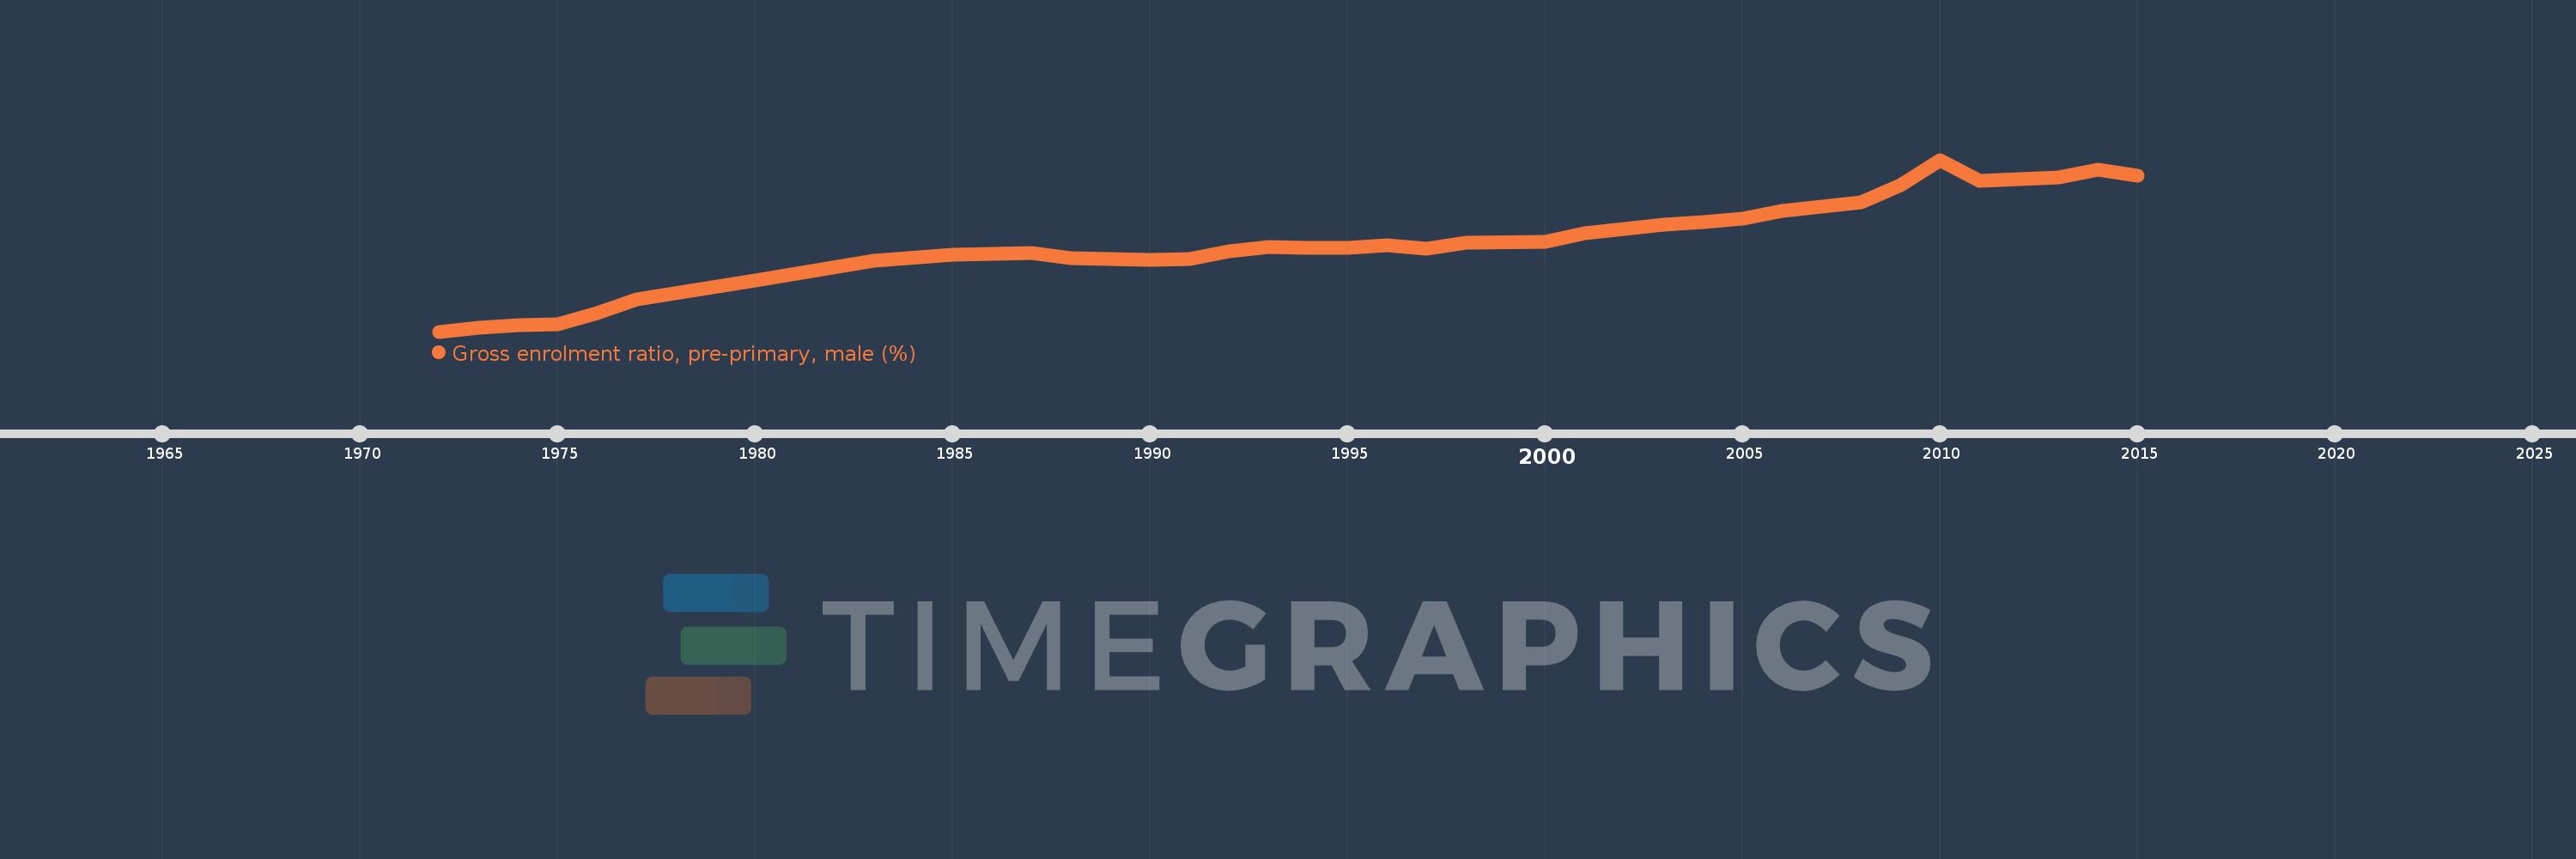
Gross enrolment ratio, pre-primary, male (%)
2015,2014,2013,2012,2011,2010,2009,2008,2007,2006,2005,2004,2003,2002,2001,2000,1998,1997,1996,1995,1994,1993,1992,1991,1990,1989,1988,1987,1986,1985,1983,1980,1977,1976,1975,1974,1973,1972
This statistics in other country:
AfghanistanAlbaniaAlgeriaAndorraAngolaAntigua and BarbudaArab WorldArgentinaArmeniaArubaAustraliaAustriaAzerbaijanBahamas, TheBahrainBangladeshBarbadosBelarusBelgiumBelizeBeninBermudaBhutanBoliviaBosnia and HerzegovinaBotswanaBrazilBrunei DarussalamBulgariaBurkina FasoBurundiCabo VerdeCambodiaCameroonCanadaCaribbean small statesCentral African RepublicCentral Europe and the BalticsChadChileChinaColombiaComorosCongo, Dem. Rep.Congo, Rep.Costa RicaCote d'IvoireCroatiaCubaCyprusCzech RepublicDenmarkDjiboutiDominicaDominican RepublicEarly-demographic dividendEast Asia & PacificEast Asia & Pacific (excluding high income)East Asia & Pacific (IDA & IBRD countries)EcuadorEgypt, Arab Rep.El SalvadorEquatorial GuineaEritreaEstoniaEthiopiaEuro areaEurope & Central AsiaEurope & Central Asia (excluding high income)Europe & Central Asia (IDA & IBRD countries)European UnionFijiFinlandFragile and conflict affected situationsFranceGabonGambia, TheGeorgiaGermanyGhanaGreeceGrenadaGuatemalaGuineaGuinea-BissauGuyanaHeavily indebted poor countries (HIPC)High incomeHondurasHong Kong SAR, ChinaHungaryIBRD onlyIcelandIDA & IBRD totalIDA blendIDA onlyIDA totalIndiaIndonesiaIran, Islamic Rep.IraqIrelandIsraelItalyJamaicaJapanJordanKazakhstanKenyaKorea, Dem. People’s Rep.Korea, Rep.KuwaitKyrgyz RepublicLao PDRLate-demographic dividendLatin America & Caribbean Latin America & Caribbean (excluding high income)Latin America & the Caribbean (IDA & IBRD countries)LatviaLeast developed countries: UN classificationLebanonLesothoLiberiaLibyaLiechtensteinLithuaniaLow & middle incomeLow incomeLower middle incomeLuxembourgMacao SAR, ChinaMacedonia, FYRMadagascarMaldivesMaliMaltaMarshall IslandsMauritaniaMauritiusMexicoMicronesia, Fed. Sts.Middle East & North AfricaMiddle East & North Africa (excluding high income)Middle East & North Africa (IDA & IBRD countries)Middle incomeMoldovaMongoliaMontenegroMoroccoMozambiqueMyanmarNamibiaNauruNepalNetherlandsNew ZealandNicaraguaNigerNigeriaNorth AmericaNorwayOECD membersOmanOther small statesPacific island small statesPakistanPalauPanamaPapua New GuineaParaguayPeruPhilippinesPolandPortugalPost-demographic dividendPre-demographic dividendPuerto RicoQatarRomaniaRussian FederationRwandaSamoaSan MarinoSao Tome and PrincipeSaudi ArabiaSenegalSerbiaSeychellesSierra LeoneSlovak RepublicSloveniaSmall statesSolomon IslandsSomaliaSouth AfricaSouth AsiaSouth Asia (IDA & IBRD)South SudanSpainSri LankaSt. Kitts and NevisSt. LuciaSt. Vincent and the GrenadinesSub-Saharan Africa Sub-Saharan Africa (excluding high income)Sub-Saharan Africa (IDA & IBRD countries)SudanSurinameSwazilandSwedenSwitzerlandSyrian Arab RepublicTajikistanTanzaniaThailandTimor-LesteTogoTongaTrinidad and TobagoTunisiaTurkeyTurkmenistanTuvaluUgandaUkraineUnited Arab EmiratesUnited KingdomUnited StatesUpper middle incomeUruguayUzbekistanVanuatuVenezuela, RBVietnamWest Bank and GazaWorldYemen, Rep.Zimbabwe Timeline:
This timeline shows a graph from 1972 to 2015 of Venezuela, RB. No data until 1971. Number of actual observations by date: 38.
Source name:
World Development Indicators
Source organization:
UNESCO Institute for Statistics
Categories, topics:
Education, Gender
Last updated:
apr 23, 2017
Indicators value changes by year
Maximum:
79.609
jan 1, 2010
At the date of observation
Value
Absolute change
Change from previous value
jan 1, 1972
4.219
+4.219
0.0%
jan 1, 1973
5.912
+1.693
40.13%
jan 1, 1974
7.055
+1.143
19.34%
jan 1, 1975
7.588
+0.534
7.57%
jan 1, 1976
12.481
+4.893
64.48%
jan 1, 1977
18.26
+5.778
46.3%
jan 1, 1980
26.553
+8.294
45.42%
jan 1, 1983
35.424
+8.871
33.41%
jan 1, 1985
37.825
+2.4
6.78%
jan 1, 1986
38.341
+0.517
1.37%
jan 1, 1987
38.856
+0.515
1.34%
jan 1, 1988
36.528
-2.329
-5.99%
jan 1, 1989
36.24
-0.287
-0.79%
jan 1, 1990
35.841
-0.399
-1.1%
jan 1, 1991
36.065
+0.224
0.62%
jan 1, 1992
39.524
+3.46
9.59%
jan 1, 1993
41.165
+1.641
4.15%
jan 1, 1994
40.884
-0.282
-0.68%
jan 1, 1995
40.907
+0.023
0.06%
jan 1, 1996
42.278
+1.371
3.35%
jan 1, 1997
40.622
-1.656
-3.92%
jan 1, 1998
43.26
+2.637
6.49%
jan 1, 2000
43.551
+0.291
0.67%
jan 1, 2001
47.371
+3.82
8.77%
jan 1, 2002
49.365
+1.994
4.21%
jan 1, 2003
51.052
+1.687
3.42%
jan 1, 2004
52.181
+1.129
2.21%
jan 1, 2005
53.799
+1.618
3.1%
jan 1, 2006
57.154
+3.355
6.24%
jan 1, 2007
59.182
+2.028
3.55%
jan 1, 2008
61.112
+1.93
3.26%
jan 1, 2009
68.384
+7.272
11.9%
jan 1, 2010
79.609
+11.225
16.41%
jan 1, 2011
70.323
-9.285
-11.66%
jan 1, 2012
71.255
+0.932
1.32%
jan 1, 2013
72.003
+0.748
1.05%
jan 1, 2014
75.324
+3.322
4.61%
jan 1, 2015
72.735
-2.589
-3.44%
Ranking of countries by current statistics by years


Comments: