29
/
en
AIzaSyAYiBZKx7MnpbEhh9jyipgxe19OcubqV5w
April 1, 2024
104928
Chile
CHL
true
2
1
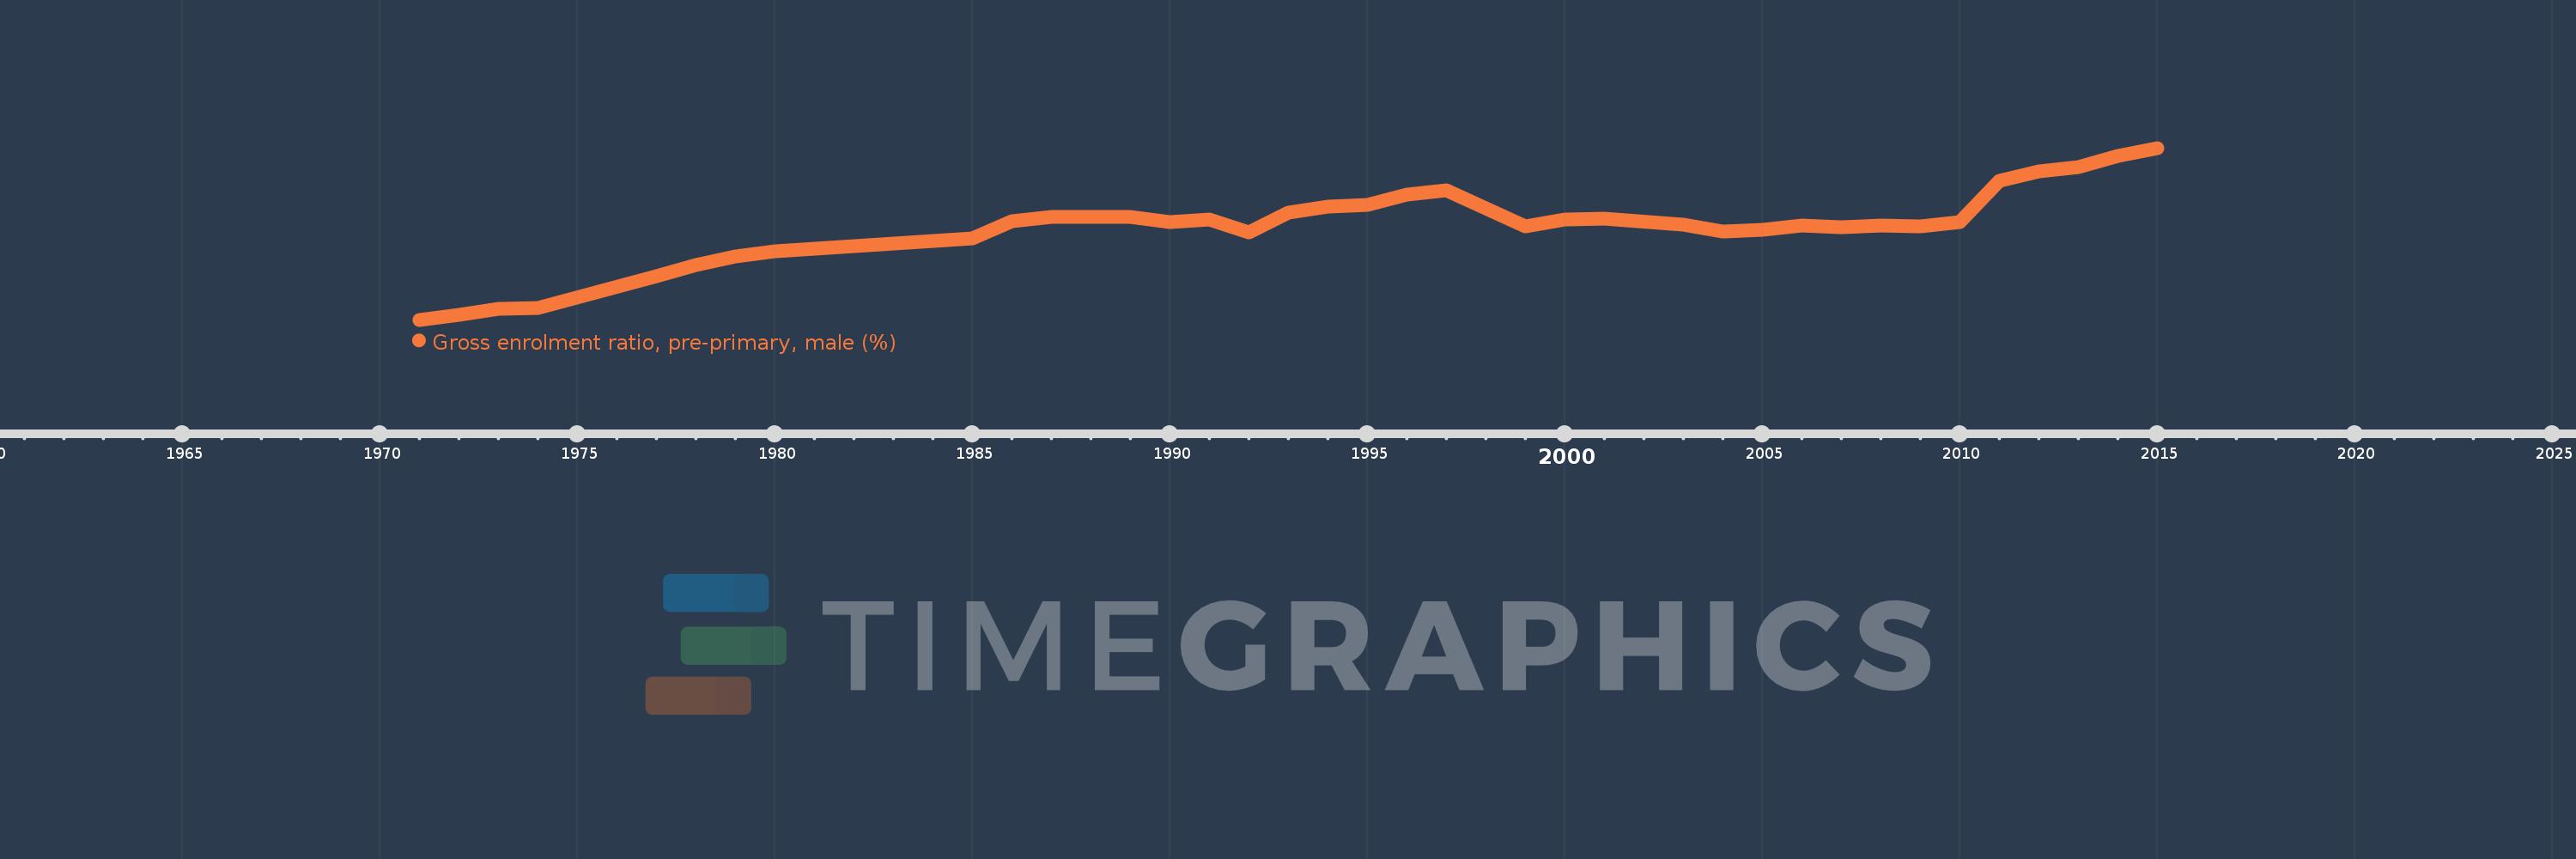
Gross enrolment ratio, pre-primary, male (%)
2015,2014,2013,2012,2011,2010,2009,2008,2007,2006,2005,2004,2003,2001,2000,1999,1997,1996,1995,1994,1993,1992,1991,1990,1989,1987,1986,1985,1980,1979,1978,1977,1974,1973,1972,1971
This statistics in other country:
AfghanistanAlbaniaAlgeriaAndorraAngolaAntigua and BarbudaArab WorldArgentinaArmeniaArubaAustraliaAustriaAzerbaijanBahamas, TheBahrainBangladeshBarbadosBelarusBelgiumBelizeBeninBermudaBhutanBoliviaBosnia and HerzegovinaBotswanaBrazilBrunei DarussalamBulgariaBurkina FasoBurundiCabo VerdeCambodiaCameroonCanadaCaribbean small statesCentral African RepublicCentral Europe and the BalticsChadChileChinaColombiaComorosCongo, Dem. Rep.Congo, Rep.Costa RicaCote d'IvoireCroatiaCubaCyprusCzech RepublicDenmarkDjiboutiDominicaDominican RepublicEarly-demographic dividendEast Asia & PacificEast Asia & Pacific (excluding high income)East Asia & Pacific (IDA & IBRD countries)EcuadorEgypt, Arab Rep.El SalvadorEquatorial GuineaEritreaEstoniaEthiopiaEuro areaEurope & Central AsiaEurope & Central Asia (excluding high income)Europe & Central Asia (IDA & IBRD countries)European UnionFijiFinlandFragile and conflict affected situationsFranceGabonGambia, TheGeorgiaGermanyGhanaGreeceGrenadaGuatemalaGuineaGuinea-BissauGuyanaHeavily indebted poor countries (HIPC)High incomeHondurasHong Kong SAR, ChinaHungaryIBRD onlyIcelandIDA & IBRD totalIDA blendIDA onlyIDA totalIndiaIndonesiaIran, Islamic Rep.IraqIrelandIsraelItalyJamaicaJapanJordanKazakhstanKenyaKorea, Dem. People’s Rep.Korea, Rep.KuwaitKyrgyz RepublicLao PDRLate-demographic dividendLatin America & Caribbean Latin America & Caribbean (excluding high income)Latin America & the Caribbean (IDA & IBRD countries)LatviaLeast developed countries: UN classificationLebanonLesothoLiberiaLibyaLiechtensteinLithuaniaLow & middle incomeLow incomeLower middle incomeLuxembourgMacao SAR, ChinaMacedonia, FYRMadagascarMaldivesMaliMaltaMarshall IslandsMauritaniaMauritiusMexicoMicronesia, Fed. Sts.Middle East & North AfricaMiddle East & North Africa (excluding high income)Middle East & North Africa (IDA & IBRD countries)Middle incomeMoldovaMongoliaMontenegroMoroccoMozambiqueMyanmarNamibiaNauruNepalNetherlandsNew ZealandNicaraguaNigerNigeriaNorth AmericaNorwayOECD membersOmanOther small statesPacific island small statesPakistanPalauPanamaPapua New GuineaParaguayPeruPhilippinesPolandPortugalPost-demographic dividendPre-demographic dividendPuerto RicoQatarRomaniaRussian FederationRwandaSamoaSan MarinoSao Tome and PrincipeSaudi ArabiaSenegalSerbiaSeychellesSierra LeoneSlovak RepublicSloveniaSmall statesSolomon IslandsSomaliaSouth AfricaSouth AsiaSouth Asia (IDA & IBRD)South SudanSpainSri LankaSt. Kitts and NevisSt. LuciaSt. Vincent and the GrenadinesSub-Saharan Africa Sub-Saharan Africa (excluding high income)Sub-Saharan Africa (IDA & IBRD countries)SudanSurinameSwazilandSwedenSwitzerlandSyrian Arab RepublicTajikistanTanzaniaThailandTimor-LesteTogoTongaTrinidad and TobagoTunisiaTurkeyTurkmenistanTuvaluUgandaUkraineUnited Arab EmiratesUnited KingdomUnited StatesUpper middle incomeUruguayUzbekistanVanuatuVenezuela, RBVietnamWest Bank and GazaWorldYemen, Rep.Zimbabwe Timeline:
This timeline shows a graph from 1971 to 2015 of Chile. No data until 1970. Number of actual observations by date: 36.
Source name:
World Development Indicators
Source organization:
UNESCO Institute for Statistics
Categories, topics:
Education, Gender
Last updated:
apr 23, 2017
Indicators value changes by year
Minimum:
22.546
jan 1, 1971
Maximum:
129.578
jan 1, 2015
At the date of observation
Value
Absolute change
Change from previous value
jan 1, 1971
22.546
+22.546
0.0%
jan 1, 1972
25.393
+2.848
12.63%
jan 1, 1973
29.173
+3.779
14.88%
jan 1, 1974
29.727
+0.554
1.9%
jan 1, 1977
49.712
+19.985
67.23%
jan 1, 1978
56.834
+7.122
14.33%
jan 1, 1979
62.211
+5.376
9.46%
jan 1, 1980
65.339
+3.128
5.03%
jan 1, 1985
73.301
+7.962
12.18%
jan 1, 1986
84.052
+10.751
14.67%
jan 1, 1987
86.501
+2.448
2.91%
jan 1, 1989
86.438
-0.062
-0.07%
jan 1, 1990
83.491
-2.948
-3.41%
jan 1, 1991
84.751
+1.261
1.51%
jan 1, 1992
77.15
-7.601
-8.97%
jan 1, 1993
89.266
+12.115
15.7%
jan 1, 1994
92.794
+3.528
3.95%
jan 1, 1995
93.905
+1.111
1.2%
jan 1, 1996
100.687
+6.782
7.22%
jan 1, 1997
103.293
+2.606
2.59%
jan 1, 1999
80.881
-22.412
-21.7%
jan 1, 2000
84.984
+4.103
5.07%
jan 1, 2001
85.63
+0.646
0.76%
jan 1, 2003
81.743
-3.887
-4.54%
jan 1, 2004
77.426
-4.317
-5.28%
jan 1, 2005
78.368
+0.942
1.22%
jan 1, 2006
81.474
+3.106
3.96%
jan 1, 2007
80.208
-1.265
-1.55%
jan 1, 2008
81.279
+1.07
1.33%
jan 1, 2009
80.455
-0.823
-1.01%
jan 1, 2010
83.159
+2.704
3.36%
jan 1, 2011
108.965
+25.805
31.03%
jan 1, 2012
114.917
+5.952
5.46%
jan 1, 2013
117.44
+2.523
2.2%
jan 1, 2014
124.733
+7.293
6.21%
jan 1, 2015
129.578
+4.845
3.88%
Ranking of countries by current statistics by years


Comments: