29
/
en
AIzaSyAYiBZKx7MnpbEhh9jyipgxe19OcubqV5w
April 1, 2024
27326
East Asia & Pacific
EAS
false
2
1
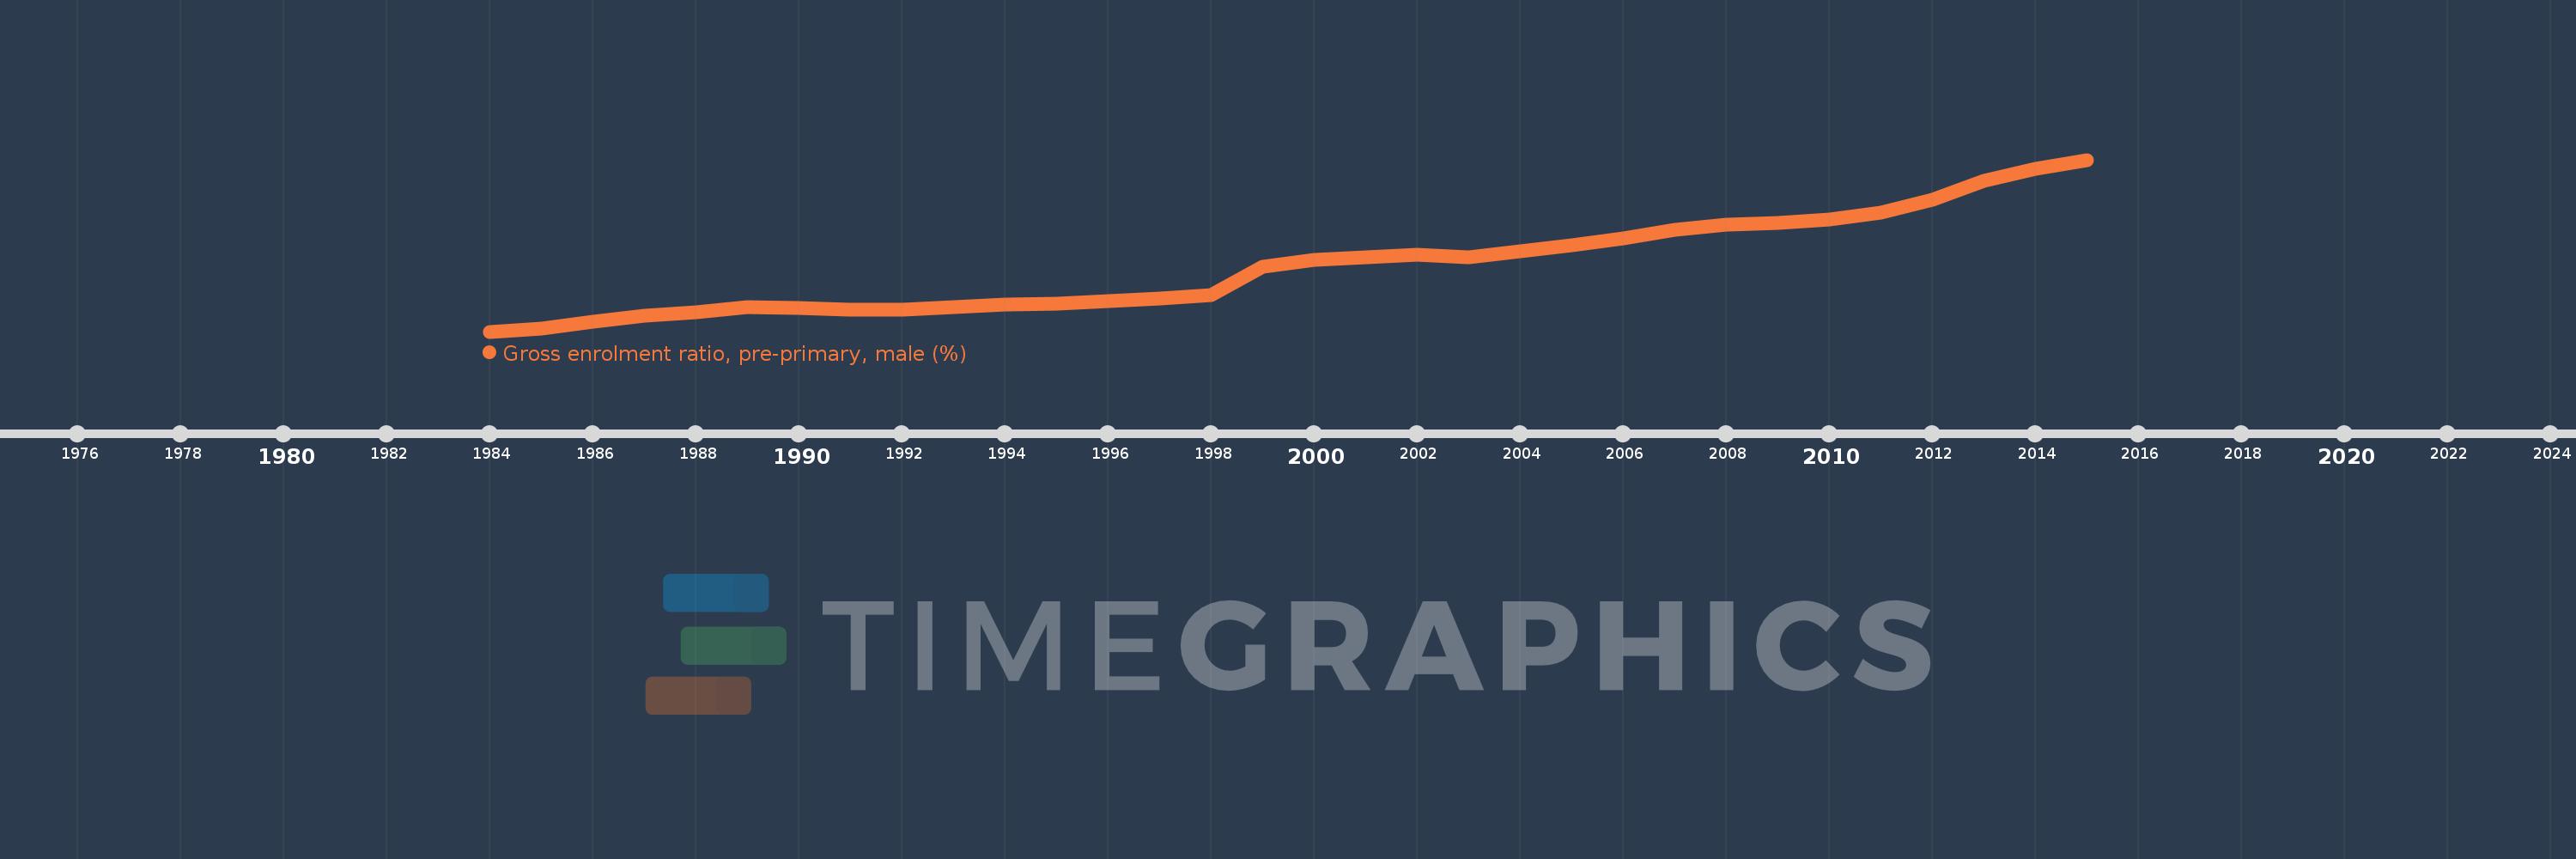
Gross enrolment ratio, pre-primary, male (%)
2015,2014,2013,2012,2011,2010,2009,2008,2007,2006,2005,2004,2003,2002,2001,2000,1999,1998,1997,1996,1995,1994,1993,1992,1991,1990,1989,1988,1987,1986,1985,1984
This statistics in other country:
AfghanistanAlbaniaAlgeriaAndorraAngolaAntigua and BarbudaArab WorldArgentinaArmeniaArubaAustraliaAustriaAzerbaijanBahamas, TheBahrainBangladeshBarbadosBelarusBelgiumBelizeBeninBermudaBhutanBoliviaBosnia and HerzegovinaBotswanaBrazilBrunei DarussalamBulgariaBurkina FasoBurundiCabo VerdeCambodiaCameroonCanadaCaribbean small statesCentral African RepublicCentral Europe and the BalticsChadChileChinaColombiaComorosCongo, Dem. Rep.Congo, Rep.Costa RicaCote d'IvoireCroatiaCubaCyprusCzech RepublicDenmarkDjiboutiDominicaDominican RepublicEarly-demographic dividendEast Asia & PacificEast Asia & Pacific (excluding high income)East Asia & Pacific (IDA & IBRD countries)EcuadorEgypt, Arab Rep.El SalvadorEquatorial GuineaEritreaEstoniaEthiopiaEuro areaEurope & Central AsiaEurope & Central Asia (excluding high income)Europe & Central Asia (IDA & IBRD countries)European UnionFijiFinlandFragile and conflict affected situationsFranceGabonGambia, TheGeorgiaGermanyGhanaGreeceGrenadaGuatemalaGuineaGuinea-BissauGuyanaHeavily indebted poor countries (HIPC)High incomeHondurasHong Kong SAR, ChinaHungaryIBRD onlyIcelandIDA & IBRD totalIDA blendIDA onlyIDA totalIndiaIndonesiaIran, Islamic Rep.IraqIrelandIsraelItalyJamaicaJapanJordanKazakhstanKenyaKorea, Dem. People’s Rep.Korea, Rep.KuwaitKyrgyz RepublicLao PDRLate-demographic dividendLatin America & Caribbean Latin America & Caribbean (excluding high income)Latin America & the Caribbean (IDA & IBRD countries)LatviaLeast developed countries: UN classificationLebanonLesothoLiberiaLibyaLiechtensteinLithuaniaLow & middle incomeLow incomeLower middle incomeLuxembourgMacao SAR, ChinaMacedonia, FYRMadagascarMaldivesMaliMaltaMarshall IslandsMauritaniaMauritiusMexicoMicronesia, Fed. Sts.Middle East & North AfricaMiddle East & North Africa (excluding high income)Middle East & North Africa (IDA & IBRD countries)Middle incomeMoldovaMongoliaMontenegroMoroccoMozambiqueMyanmarNamibiaNauruNepalNetherlandsNew ZealandNicaraguaNigerNigeriaNorth AmericaNorwayOECD membersOmanOther small statesPacific island small statesPakistanPalauPanamaPapua New GuineaParaguayPeruPhilippinesPolandPortugalPost-demographic dividendPre-demographic dividendPuerto RicoQatarRomaniaRussian FederationRwandaSamoaSan MarinoSao Tome and PrincipeSaudi ArabiaSenegalSerbiaSeychellesSierra LeoneSlovak RepublicSloveniaSmall statesSolomon IslandsSomaliaSouth AfricaSouth AsiaSouth Asia (IDA & IBRD)South SudanSpainSri LankaSt. Kitts and NevisSt. LuciaSt. Vincent and the GrenadinesSub-Saharan Africa Sub-Saharan Africa (excluding high income)Sub-Saharan Africa (IDA & IBRD countries)SudanSurinameSwazilandSwedenSwitzerlandSyrian Arab RepublicTajikistanTanzaniaThailandTimor-LesteTogoTongaTrinidad and TobagoTunisiaTurkeyTurkmenistanTuvaluUgandaUkraineUnited Arab EmiratesUnited KingdomUnited StatesUpper middle incomeUruguayUzbekistanVanuatuVenezuela, RBVietnamWest Bank and GazaWorldYemen, Rep.Zimbabwe Timeline:
This timeline shows a graph from 1984 to 2015 of East Asia & Pacific. No data until 1983. Number of actual observations by date: 32.
Source name:
World Development Indicators
Source organization:
UNESCO Institute for Statistics
Categories, topics:
Education, Gender
Last updated:
apr 23, 2017
Indicators value changes by year
Maximum:
76.188
jan 1, 2015
At the date of observation
Value
Absolute change
Change from previous value
jan 1, 1984
16.42
+16.42
0.0%
jan 1, 1985
17.615
+1.195
7.28%
jan 1, 1986
19.884
+2.269
12.88%
jan 1, 1987
21.9
+2.016
10.14%
jan 1, 1988
23.229
+1.33
6.07%
jan 1, 1989
24.918
+1.689
7.27%
jan 1, 1990
24.74
-0.178
-0.71%
jan 1, 1991
23.951
-0.789
-3.19%
jan 1, 1992
24.007
+0.056
0.23%
jan 1, 1993
24.993
+0.986
4.11%
jan 1, 1994
25.708
+0.715
2.86%
jan 1, 1995
26.105
+0.397
1.55%
jan 1, 1996
26.997
+0.892
3.42%
jan 1, 1997
27.811
+0.814
3.01%
jan 1, 1998
29.023
+1.212
4.36%
jan 1, 1999
38.843
+9.82
33.84%
jan 1, 2000
41.404
+2.561
6.59%
jan 1, 2001
42.224
+0.82
1.98%
jan 1, 2002
43.056
+0.832
1.97%
jan 1, 2003
42.402
-0.654
-1.52%
jan 1, 2004
44.467
+2.064
4.87%
jan 1, 2005
46.393
+1.927
4.33%
jan 1, 2006
48.933
+2.54
5.48%
jan 1, 2007
51.904
+2.97
6.07%
jan 1, 2008
53.742
+1.838
3.54%
jan 1, 2009
54.277
+0.535
1.0%
jan 1, 2010
55.416
+1.139
2.1%
jan 1, 2011
57.83
+2.414
4.36%
jan 1, 2012
62.291
+4.461
7.71%
jan 1, 2013
68.986
+6.694
10.75%
jan 1, 2014
73.054
+4.068
5.9%
jan 1, 2015
76.188
+3.134
4.29%
Ranking of countries by current statistics by years


Comments: