29
/
en
AIzaSyAYiBZKx7MnpbEhh9jyipgxe19OcubqV5w
April 1, 2024
39950
IDA total
IDA
false
2
1
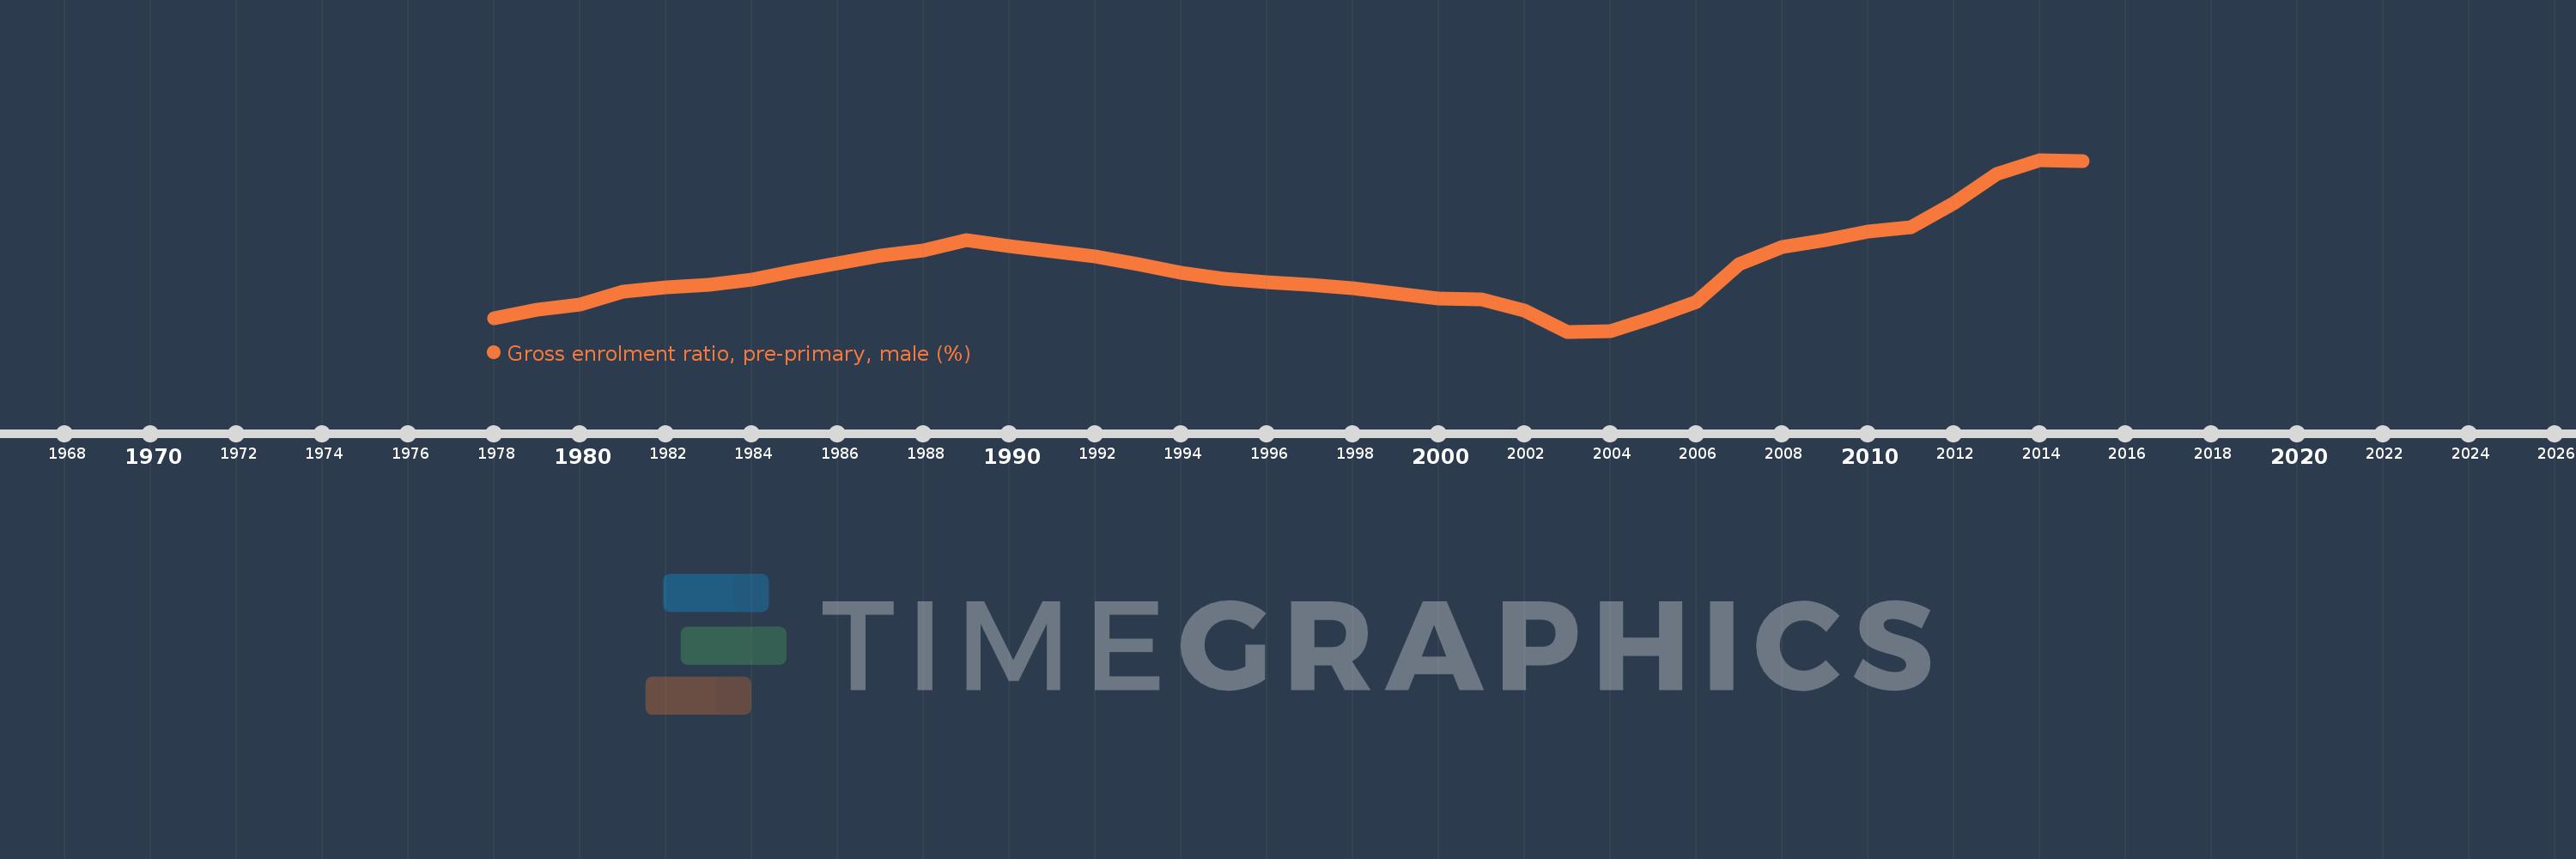
Gross enrolment ratio, pre-primary, male (%)
2015,2014,2013,2012,2011,2010,2009,2008,2007,2006,2005,2004,2003,2002,2001,2000,1999,1998,1997,1996,1995,1994,1993,1992,1991,1990,1989,1988,1987,1986,1985,1984,1983,1982,1981,1980,1979,1978
This statistics in other country:
AfghanistanAlbaniaAlgeriaAndorraAngolaAntigua and BarbudaArab WorldArgentinaArmeniaArubaAustraliaAustriaAzerbaijanBahamas, TheBahrainBangladeshBarbadosBelarusBelgiumBelizeBeninBermudaBhutanBoliviaBosnia and HerzegovinaBotswanaBrazilBrunei DarussalamBulgariaBurkina FasoBurundiCabo VerdeCambodiaCameroonCanadaCaribbean small statesCentral African RepublicCentral Europe and the BalticsChadChileChinaColombiaComorosCongo, Dem. Rep.Congo, Rep.Costa RicaCote d'IvoireCroatiaCubaCyprusCzech RepublicDenmarkDjiboutiDominicaDominican RepublicEarly-demographic dividendEast Asia & PacificEast Asia & Pacific (excluding high income)East Asia & Pacific (IDA & IBRD countries)EcuadorEgypt, Arab Rep.El SalvadorEquatorial GuineaEritreaEstoniaEthiopiaEuro areaEurope & Central AsiaEurope & Central Asia (excluding high income)Europe & Central Asia (IDA & IBRD countries)European UnionFijiFinlandFragile and conflict affected situationsFranceGabonGambia, TheGeorgiaGermanyGhanaGreeceGrenadaGuatemalaGuineaGuinea-BissauGuyanaHeavily indebted poor countries (HIPC)High incomeHondurasHong Kong SAR, ChinaHungaryIBRD onlyIcelandIDA & IBRD totalIDA blendIDA onlyIDA totalIndiaIndonesiaIran, Islamic Rep.IraqIrelandIsraelItalyJamaicaJapanJordanKazakhstanKenyaKorea, Dem. People’s Rep.Korea, Rep.KuwaitKyrgyz RepublicLao PDRLate-demographic dividendLatin America & Caribbean Latin America & Caribbean (excluding high income)Latin America & the Caribbean (IDA & IBRD countries)LatviaLeast developed countries: UN classificationLebanonLesothoLiberiaLibyaLiechtensteinLithuaniaLow & middle incomeLow incomeLower middle incomeLuxembourgMacao SAR, ChinaMacedonia, FYRMadagascarMaldivesMaliMaltaMarshall IslandsMauritaniaMauritiusMexicoMicronesia, Fed. Sts.Middle East & North AfricaMiddle East & North Africa (excluding high income)Middle East & North Africa (IDA & IBRD countries)Middle incomeMoldovaMongoliaMontenegroMoroccoMozambiqueMyanmarNamibiaNauruNepalNetherlandsNew ZealandNicaraguaNigerNigeriaNorth AmericaNorwayOECD membersOmanOther small statesPacific island small statesPakistanPalauPanamaPapua New GuineaParaguayPeruPhilippinesPolandPortugalPost-demographic dividendPre-demographic dividendPuerto RicoQatarRomaniaRussian FederationRwandaSamoaSan MarinoSao Tome and PrincipeSaudi ArabiaSenegalSerbiaSeychellesSierra LeoneSlovak RepublicSloveniaSmall statesSolomon IslandsSomaliaSouth AfricaSouth AsiaSouth Asia (IDA & IBRD)South SudanSpainSri LankaSt. Kitts and NevisSt. LuciaSt. Vincent and the GrenadinesSub-Saharan Africa Sub-Saharan Africa (excluding high income)Sub-Saharan Africa (IDA & IBRD countries)SudanSurinameSwazilandSwedenSwitzerlandSyrian Arab RepublicTajikistanTanzaniaThailandTimor-LesteTogoTongaTrinidad and TobagoTunisiaTurkeyTurkmenistanTuvaluUgandaUkraineUnited Arab EmiratesUnited KingdomUnited StatesUpper middle incomeUruguayUzbekistanVanuatuVenezuela, RBVietnamWest Bank and GazaWorldYemen, Rep.Zimbabwe Timeline:
This timeline shows a graph from 1978 to 2015 of IDA total. No data until 1977. Number of actual observations by date: 38.
Source name:
World Development Indicators
Source organization:
UNESCO Institute for Statistics
Categories, topics:
Education, Gender
Last updated:
apr 23, 2017
Indicators value changes by year
Minimum:
17.051
jan 1, 2003
Maximum:
28.969
jan 1, 2014
At the date of observation
Value
Absolute change
Change from previous value
jan 1, 1978
17.958
+17.958
0.0%
jan 1, 1979
18.547
+0.589
3.28%
jan 1, 1980
18.92
+0.373
2.01%
jan 1, 1981
19.831
+0.911
4.82%
jan 1, 1982
20.137
+0.306
1.54%
jan 1, 1983
20.279
+0.142
0.7%
jan 1, 1984
20.655
+0.376
1.85%
jan 1, 1985
21.238
+0.583
2.82%
jan 1, 1986
21.787
+0.549
2.59%
jan 1, 1987
22.324
+0.537
2.47%
jan 1, 1988
22.678
+0.353
1.58%
jan 1, 1989
23.368
+0.69
3.04%
jan 1, 1990
23.005
-0.363
-1.55%
jan 1, 1991
22.633
-0.372
-1.62%
jan 1, 1992
22.244
-0.389
-1.72%
jan 1, 1993
21.757
-0.487
-2.19%
jan 1, 1994
21.159
-0.599
-2.75%
jan 1, 1995
20.721
-0.438
-2.07%
jan 1, 1996
20.463
-0.258
-1.24%
jan 1, 1997
20.297
-0.166
-0.81%
jan 1, 1998
20.055
-0.242
-1.19%
jan 1, 1999
19.673
-0.382
-1.91%
jan 1, 2000
19.325
-0.348
-1.77%
jan 1, 2001
19.294
-0.031
-0.16%
jan 1, 2002
18.522
-0.772
-4.0%
jan 1, 2003
17.051
-1.471
-7.94%
jan 1, 2004
17.09
+0.04
0.23%
jan 1, 2005
18.006
+0.915
5.36%
jan 1, 2006
19.119
+1.114
6.19%
jan 1, 2007
21.742
+2.622
13.72%
jan 1, 2008
22.908
+1.167
5.37%
jan 1, 2009
23.403
+0.495
2.16%
jan 1, 2010
24.018
+0.615
2.63%
jan 1, 2011
24.31
+0.292
1.22%
jan 1, 2012
25.96
+1.65
6.79%
jan 1, 2013
27.986
+2.027
7.81%
jan 1, 2014
28.969
+0.983
3.51%
jan 1, 2015
28.897
-0.072
-0.25%
Ranking of countries by current statistics by years


Comments: