29
/
en
AIzaSyAYiBZKx7MnpbEhh9jyipgxe19OcubqV5w
April 1, 2024
269383
Turkey
TUR
true
2
1
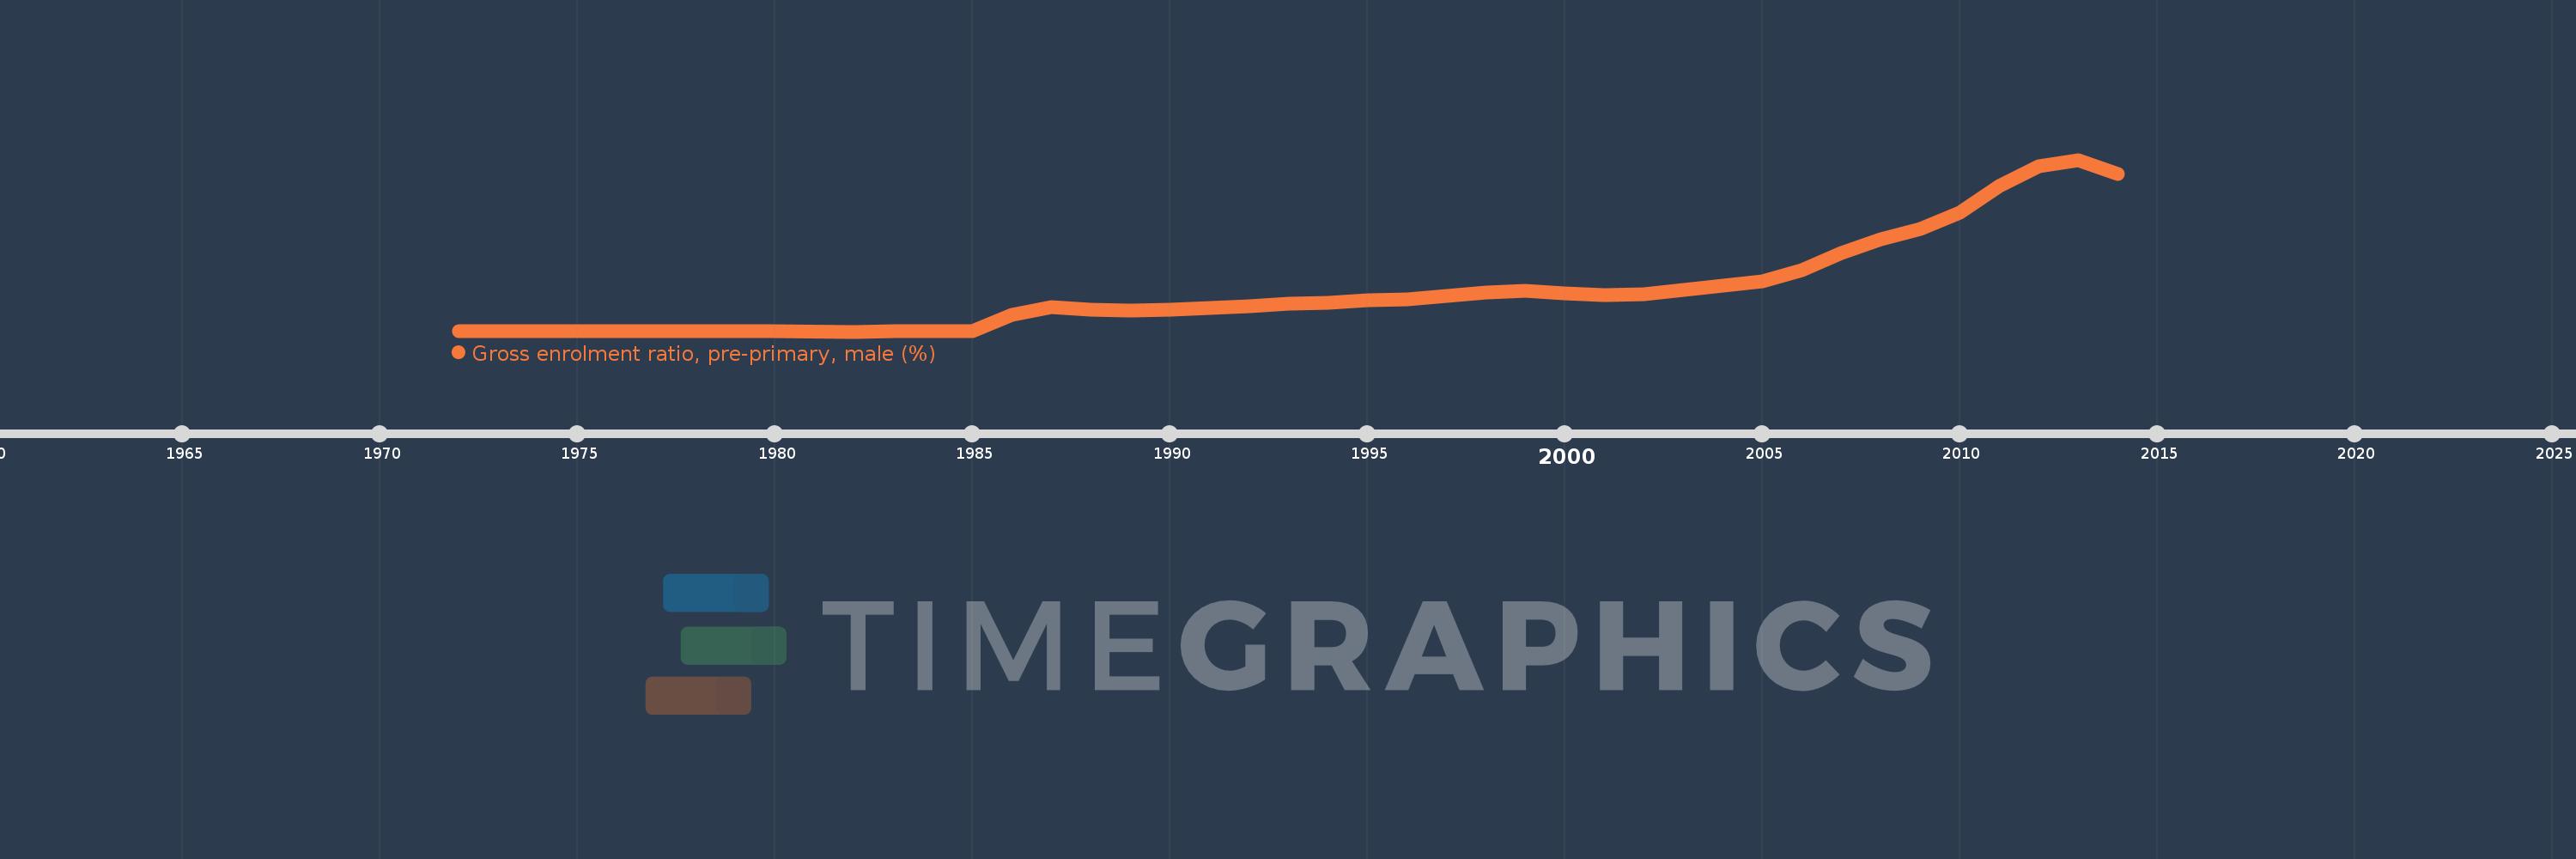
Gross enrolment ratio, pre-primary, male (%)
2014,2013,2012,2011,2010,2009,2008,2007,2006,2005,2004,2003,2002,2001,2000,1999,1998,1996,1995,1994,1993,1992,1991,1990,1989,1988,1987,1986,1985,1984,1983,1982,1980,1979,1976,1975,1974,1973,1972
This statistics in other country:
AfghanistanAlbaniaAlgeriaAndorraAngolaAntigua and BarbudaArab WorldArgentinaArmeniaArubaAustraliaAustriaAzerbaijanBahamas, TheBahrainBangladeshBarbadosBelarusBelgiumBelizeBeninBermudaBhutanBoliviaBosnia and HerzegovinaBotswanaBrazilBrunei DarussalamBulgariaBurkina FasoBurundiCabo VerdeCambodiaCameroonCanadaCaribbean small statesCentral African RepublicCentral Europe and the BalticsChadChileChinaColombiaComorosCongo, Dem. Rep.Congo, Rep.Costa RicaCote d'IvoireCroatiaCubaCyprusCzech RepublicDenmarkDjiboutiDominicaDominican RepublicEarly-demographic dividendEast Asia & PacificEast Asia & Pacific (excluding high income)East Asia & Pacific (IDA & IBRD countries)EcuadorEgypt, Arab Rep.El SalvadorEquatorial GuineaEritreaEstoniaEthiopiaEuro areaEurope & Central AsiaEurope & Central Asia (excluding high income)Europe & Central Asia (IDA & IBRD countries)European UnionFijiFinlandFragile and conflict affected situationsFranceGabonGambia, TheGeorgiaGermanyGhanaGreeceGrenadaGuatemalaGuineaGuinea-BissauGuyanaHeavily indebted poor countries (HIPC)High incomeHondurasHong Kong SAR, ChinaHungaryIBRD onlyIcelandIDA & IBRD totalIDA blendIDA onlyIDA totalIndiaIndonesiaIran, Islamic Rep.IraqIrelandIsraelItalyJamaicaJapanJordanKazakhstanKenyaKorea, Dem. People’s Rep.Korea, Rep.KuwaitKyrgyz RepublicLao PDRLate-demographic dividendLatin America & Caribbean Latin America & Caribbean (excluding high income)Latin America & the Caribbean (IDA & IBRD countries)LatviaLeast developed countries: UN classificationLebanonLesothoLiberiaLibyaLiechtensteinLithuaniaLow & middle incomeLow incomeLower middle incomeLuxembourgMacao SAR, ChinaMacedonia, FYRMadagascarMaldivesMaliMaltaMarshall IslandsMauritaniaMauritiusMexicoMicronesia, Fed. Sts.Middle East & North AfricaMiddle East & North Africa (excluding high income)Middle East & North Africa (IDA & IBRD countries)Middle incomeMoldovaMongoliaMontenegroMoroccoMozambiqueMyanmarNamibiaNauruNepalNetherlandsNew ZealandNicaraguaNigerNigeriaNorth AmericaNorwayOECD membersOmanOther small statesPacific island small statesPakistanPalauPanamaPapua New GuineaParaguayPeruPhilippinesPolandPortugalPost-demographic dividendPre-demographic dividendPuerto RicoQatarRomaniaRussian FederationRwandaSamoaSan MarinoSao Tome and PrincipeSaudi ArabiaSenegalSerbiaSeychellesSierra LeoneSlovak RepublicSloveniaSmall statesSolomon IslandsSomaliaSouth AfricaSouth AsiaSouth Asia (IDA & IBRD)South SudanSpainSri LankaSt. Kitts and NevisSt. LuciaSt. Vincent and the GrenadinesSub-Saharan Africa Sub-Saharan Africa (excluding high income)Sub-Saharan Africa (IDA & IBRD countries)SudanSurinameSwazilandSwedenSwitzerlandSyrian Arab RepublicTajikistanTanzaniaThailandTimor-LesteTogoTongaTrinidad and TobagoTunisiaTurkeyTurkmenistanTuvaluUgandaUkraineUnited Arab EmiratesUnited KingdomUnited StatesUpper middle incomeUruguayUzbekistanVanuatuVenezuela, RBVietnamWest Bank and GazaWorldYemen, Rep.Zimbabwe Timeline:
This timeline shows a graph from 1972 to 2014 of Turkey. No data until 1971. Number of actual observations by date: 39.
Source name:
World Development Indicators
Source organization:
UNESCO Institute for Statistics
Categories, topics:
Education, Gender
Last updated:
apr 23, 2017
Indicators value changes by year
Maximum:
30.705
jan 1, 2013
At the date of observation
Value
Absolute change
Change from previous value
jan 1, 1972
0.225
+0.225
0.0%
jan 1, 1973
0.277
+0.053
23.5%
jan 1, 1974
0.293
+0.016
5.8%
jan 1, 1975
0.289
-0.004
-1.45%
jan 1, 1976
0.247
-0.042
-14.45%
jan 1, 1979
0.222
-0.025
-10.25%
jan 1, 1980
0.24
+0.018
7.9%
jan 1, 1982
0.207
-0.033
-13.62%
jan 1, 1983
0.237
+0.03
14.43%
jan 1, 1984
0.243
+0.006
2.73%
jan 1, 1985
0.249
+0.006
2.42%
jan 1, 1986
3.162
+2.912
1.17K%
jan 1, 1987
4.535
+1.373
43.44%
jan 1, 1988
4.036
-0.499
-11.0%
jan 1, 1989
3.97
-0.066
-1.64%
jan 1, 1990
4.094
+0.124
3.12%
jan 1, 1991
4.352
+0.258
6.31%
jan 1, 1992
4.642
+0.29
6.66%
jan 1, 1993
5.187
+0.545
11.73%
jan 1, 1994
5.341
+0.154
2.97%
jan 1, 1995
5.736
+0.396
7.41%
jan 1, 1996
5.913
+0.177
3.09%
jan 1, 1998
7.113
+1.199
20.28%
jan 1, 1999
7.432
+0.319
4.48%
jan 1, 2000
7.015
-0.417
-5.61%
jan 1, 2001
6.718
-0.297
-4.23%
jan 1, 2002
6.878
+0.16
2.38%
jan 1, 2003
7.608
+0.73
10.61%
jan 1, 2004
8.301
+0.693
9.11%
jan 1, 2005
9.172
+0.871
10.49%
jan 1, 2006
11.154
+1.982
21.61%
jan 1, 2007
14.115
+2.961
26.55%
jan 1, 2008
16.599
+2.484
17.6%
jan 1, 2009
18.384
+1.785
10.75%
jan 1, 2010
21.367
+2.983
16.22%
jan 1, 2011
26.041
+4.674
21.88%
jan 1, 2012
29.546
+3.505
13.46%
jan 1, 2013
30.705
+1.159
3.92%
jan 1, 2014
28.176
-2.528
-8.23%
Ranking of countries by current statistics by years


Comments: