29
/
en
AIzaSyAYiBZKx7MnpbEhh9jyipgxe19OcubqV5w
April 1, 2024
123547
Ecuador
ECU
true
2
1
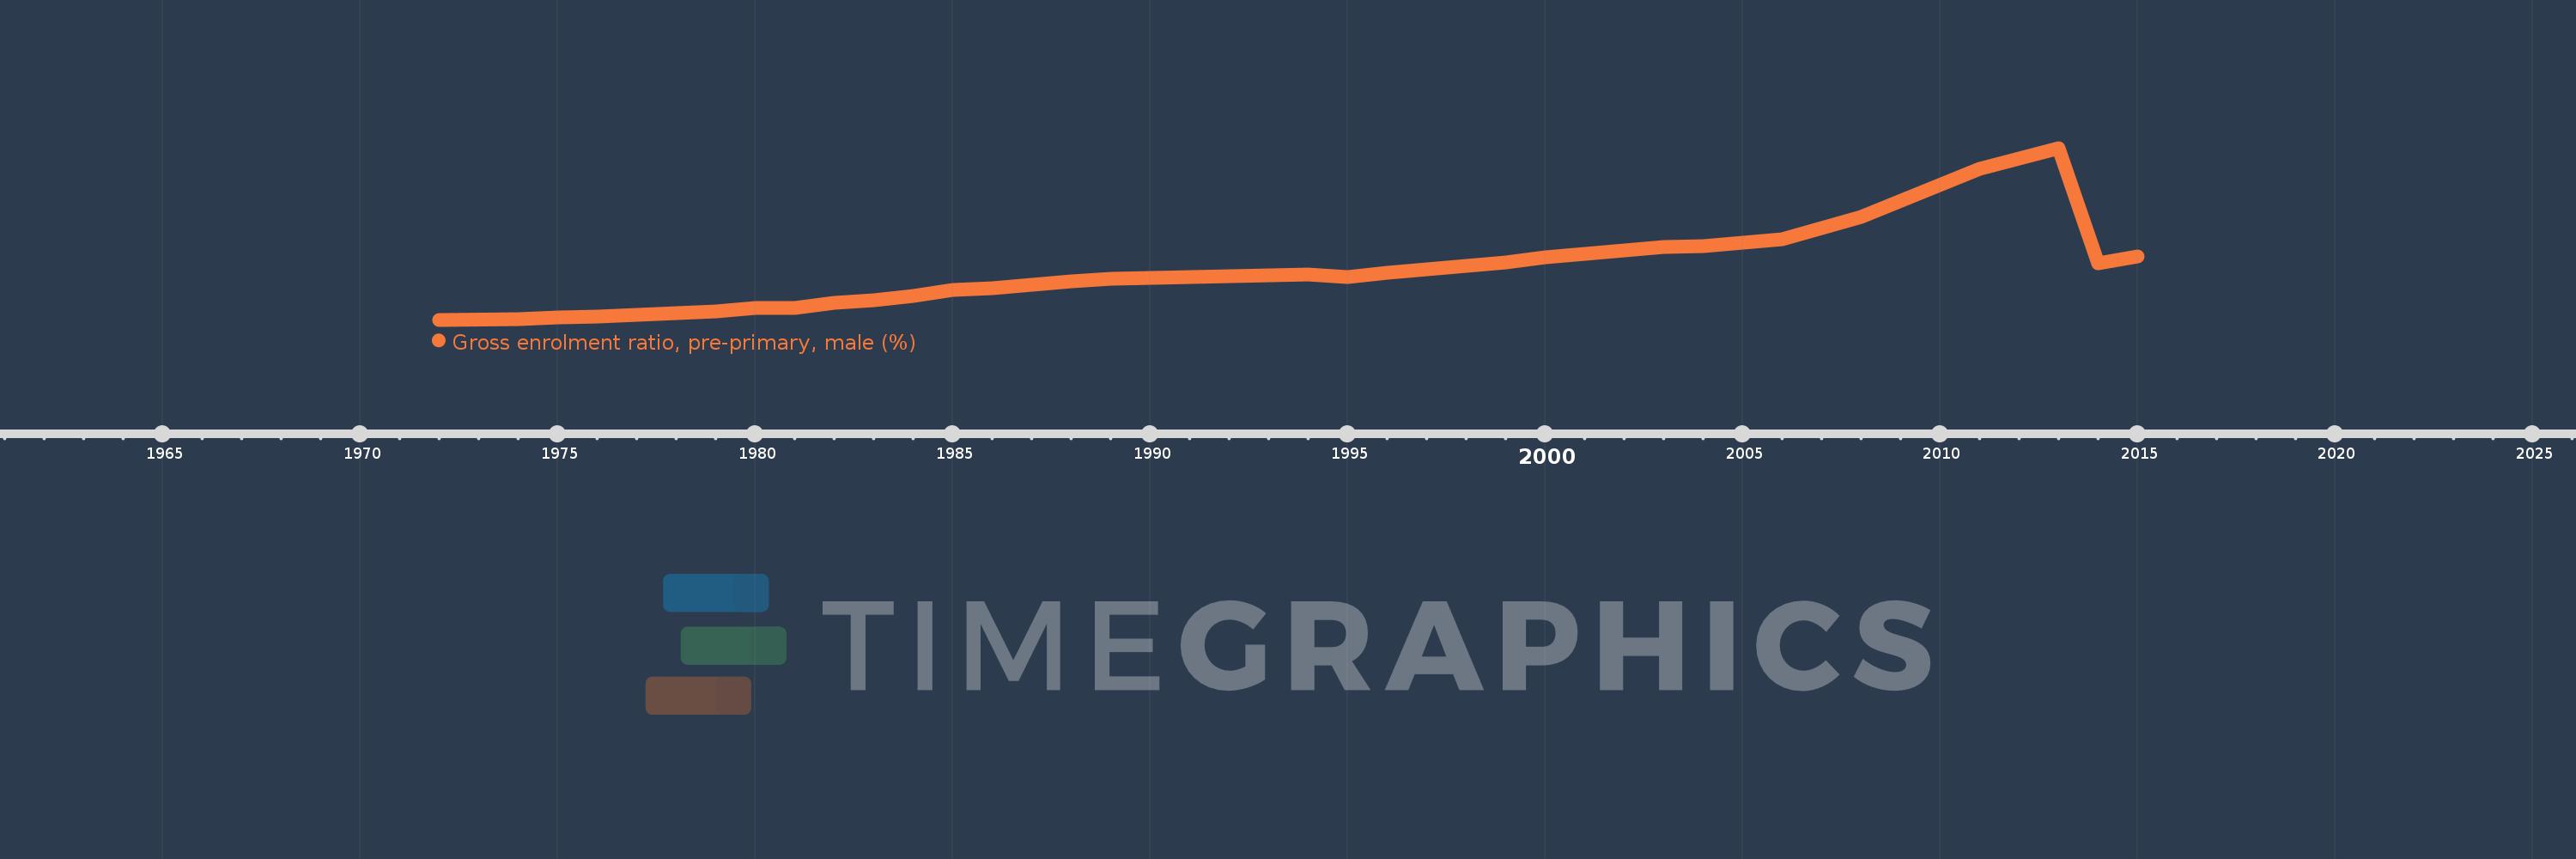
Gross enrolment ratio, pre-primary, male (%)
2015,2014,2013,2012,2011,2008,2007,2006,2005,2004,2003,2002,2001,2000,1999,1998,1997,1996,1995,1994,1989,1988,1987,1986,1985,1984,1983,1982,1981,1980,1979,1978,1977,1976,1975,1974,1972
This statistics in other country:
AfghanistanAlbaniaAlgeriaAndorraAngolaAntigua and BarbudaArab WorldArgentinaArmeniaArubaAustraliaAustriaAzerbaijanBahamas, TheBahrainBangladeshBarbadosBelarusBelgiumBelizeBeninBermudaBhutanBoliviaBosnia and HerzegovinaBotswanaBrazilBrunei DarussalamBulgariaBurkina FasoBurundiCabo VerdeCambodiaCameroonCanadaCaribbean small statesCentral African RepublicCentral Europe and the BalticsChadChileChinaColombiaComorosCongo, Dem. Rep.Congo, Rep.Costa RicaCote d'IvoireCroatiaCubaCyprusCzech RepublicDenmarkDjiboutiDominicaDominican RepublicEarly-demographic dividendEast Asia & PacificEast Asia & Pacific (excluding high income)East Asia & Pacific (IDA & IBRD countries)EcuadorEgypt, Arab Rep.El SalvadorEquatorial GuineaEritreaEstoniaEthiopiaEuro areaEurope & Central AsiaEurope & Central Asia (excluding high income)Europe & Central Asia (IDA & IBRD countries)European UnionFijiFinlandFragile and conflict affected situationsFranceGabonGambia, TheGeorgiaGermanyGhanaGreeceGrenadaGuatemalaGuineaGuinea-BissauGuyanaHeavily indebted poor countries (HIPC)High incomeHondurasHong Kong SAR, ChinaHungaryIBRD onlyIcelandIDA & IBRD totalIDA blendIDA onlyIDA totalIndiaIndonesiaIran, Islamic Rep.IraqIrelandIsraelItalyJamaicaJapanJordanKazakhstanKenyaKorea, Dem. People’s Rep.Korea, Rep.KuwaitKyrgyz RepublicLao PDRLate-demographic dividendLatin America & Caribbean Latin America & Caribbean (excluding high income)Latin America & the Caribbean (IDA & IBRD countries)LatviaLeast developed countries: UN classificationLebanonLesothoLiberiaLibyaLiechtensteinLithuaniaLow & middle incomeLow incomeLower middle incomeLuxembourgMacao SAR, ChinaMacedonia, FYRMadagascarMaldivesMaliMaltaMarshall IslandsMauritaniaMauritiusMexicoMicronesia, Fed. Sts.Middle East & North AfricaMiddle East & North Africa (excluding high income)Middle East & North Africa (IDA & IBRD countries)Middle incomeMoldovaMongoliaMontenegroMoroccoMozambiqueMyanmarNamibiaNauruNepalNetherlandsNew ZealandNicaraguaNigerNigeriaNorth AmericaNorwayOECD membersOmanOther small statesPacific island small statesPakistanPalauPanamaPapua New GuineaParaguayPeruPhilippinesPolandPortugalPost-demographic dividendPre-demographic dividendPuerto RicoQatarRomaniaRussian FederationRwandaSamoaSan MarinoSao Tome and PrincipeSaudi ArabiaSenegalSerbiaSeychellesSierra LeoneSlovak RepublicSloveniaSmall statesSolomon IslandsSomaliaSouth AfricaSouth AsiaSouth Asia (IDA & IBRD)South SudanSpainSri LankaSt. Kitts and NevisSt. LuciaSt. Vincent and the GrenadinesSub-Saharan Africa Sub-Saharan Africa (excluding high income)Sub-Saharan Africa (IDA & IBRD countries)SudanSurinameSwazilandSwedenSwitzerlandSyrian Arab RepublicTajikistanTanzaniaThailandTimor-LesteTogoTongaTrinidad and TobagoTunisiaTurkeyTurkmenistanTuvaluUgandaUkraineUnited Arab EmiratesUnited KingdomUnited StatesUpper middle incomeUruguayUzbekistanVanuatuVenezuela, RBVietnamWest Bank and GazaWorldYemen, Rep.Zimbabwe Timeline:
This timeline shows a graph from 1972 to 2015 of Ecuador. No data until 1971. Number of actual observations by date: 37.
Source name:
World Development Indicators
Source organization:
UNESCO Institute for Statistics
Categories, topics:
Education, Gender
Last updated:
apr 23, 2017
Indicators value changes by year
Maximum:
153.041
jan 1, 2013
At the date of observation
Value
Absolute change
Change from previous value
jan 1, 1972
7.137
+7.137
0.0%
jan 1, 1974
7.906
+0.769
10.78%
jan 1, 1975
8.848
+0.942
11.92%
jan 1, 1976
9.907
+1.059
11.96%
jan 1, 1977
10.935
+1.028
10.37%
jan 1, 1978
12.554
+1.619
14.81%
jan 1, 1979
14.249
+1.696
13.51%
jan 1, 1980
17.059
+2.809
19.71%
jan 1, 1981
17.321
+0.263
1.54%
jan 1, 1982
21.304
+3.983
22.99%
jan 1, 1983
23.738
+2.434
11.43%
jan 1, 1984
27.177
+3.439
14.49%
jan 1, 1985
32.467
+5.289
19.46%
jan 1, 1986
33.751
+1.284
3.95%
jan 1, 1987
36.972
+3.222
9.55%
jan 1, 1988
39.903
+2.931
7.93%
jan 1, 1989
41.679
+1.776
4.45%
jan 1, 1994
45.592
+3.913
9.39%
jan 1, 1995
43.258
-2.335
-5.12%
jan 1, 1996
47.209
+3.951
9.13%
jan 1, 1997
49.616
+2.407
5.1%
jan 1, 1998
52.863
+3.247
6.54%
jan 1, 1999
56.117
+3.254
6.16%
jan 1, 2000
60.256
+4.139
7.38%
jan 1, 2001
62.911
+2.655
4.41%
jan 1, 2002
65.902
+2.991
4.75%
jan 1, 2003
68.653
+2.751
4.17%
jan 1, 2004
69.546
+0.893
1.3%
jan 1, 2005
72.868
+3.322
4.78%
jan 1, 2006
75.423
+2.555
3.51%
jan 1, 2007
85.178
+9.755
12.93%
jan 1, 2008
94.774
+9.596
11.27%
jan 1, 2011
135.213
+40.439
42.67%
jan 1, 2012
144.193
+8.98
6.64%
jan 1, 2013
153.041
+8.849
6.14%
jan 1, 2014
54.999
-98.043
-64.06%
jan 1, 2015
60.967
+5.968
10.85%
Ranking of countries by current statistics by years


Comments: