29
/
en
AIzaSyAYiBZKx7MnpbEhh9jyipgxe19OcubqV5w
April 1, 2024
126234
El Salvador
SLV
true
2
1
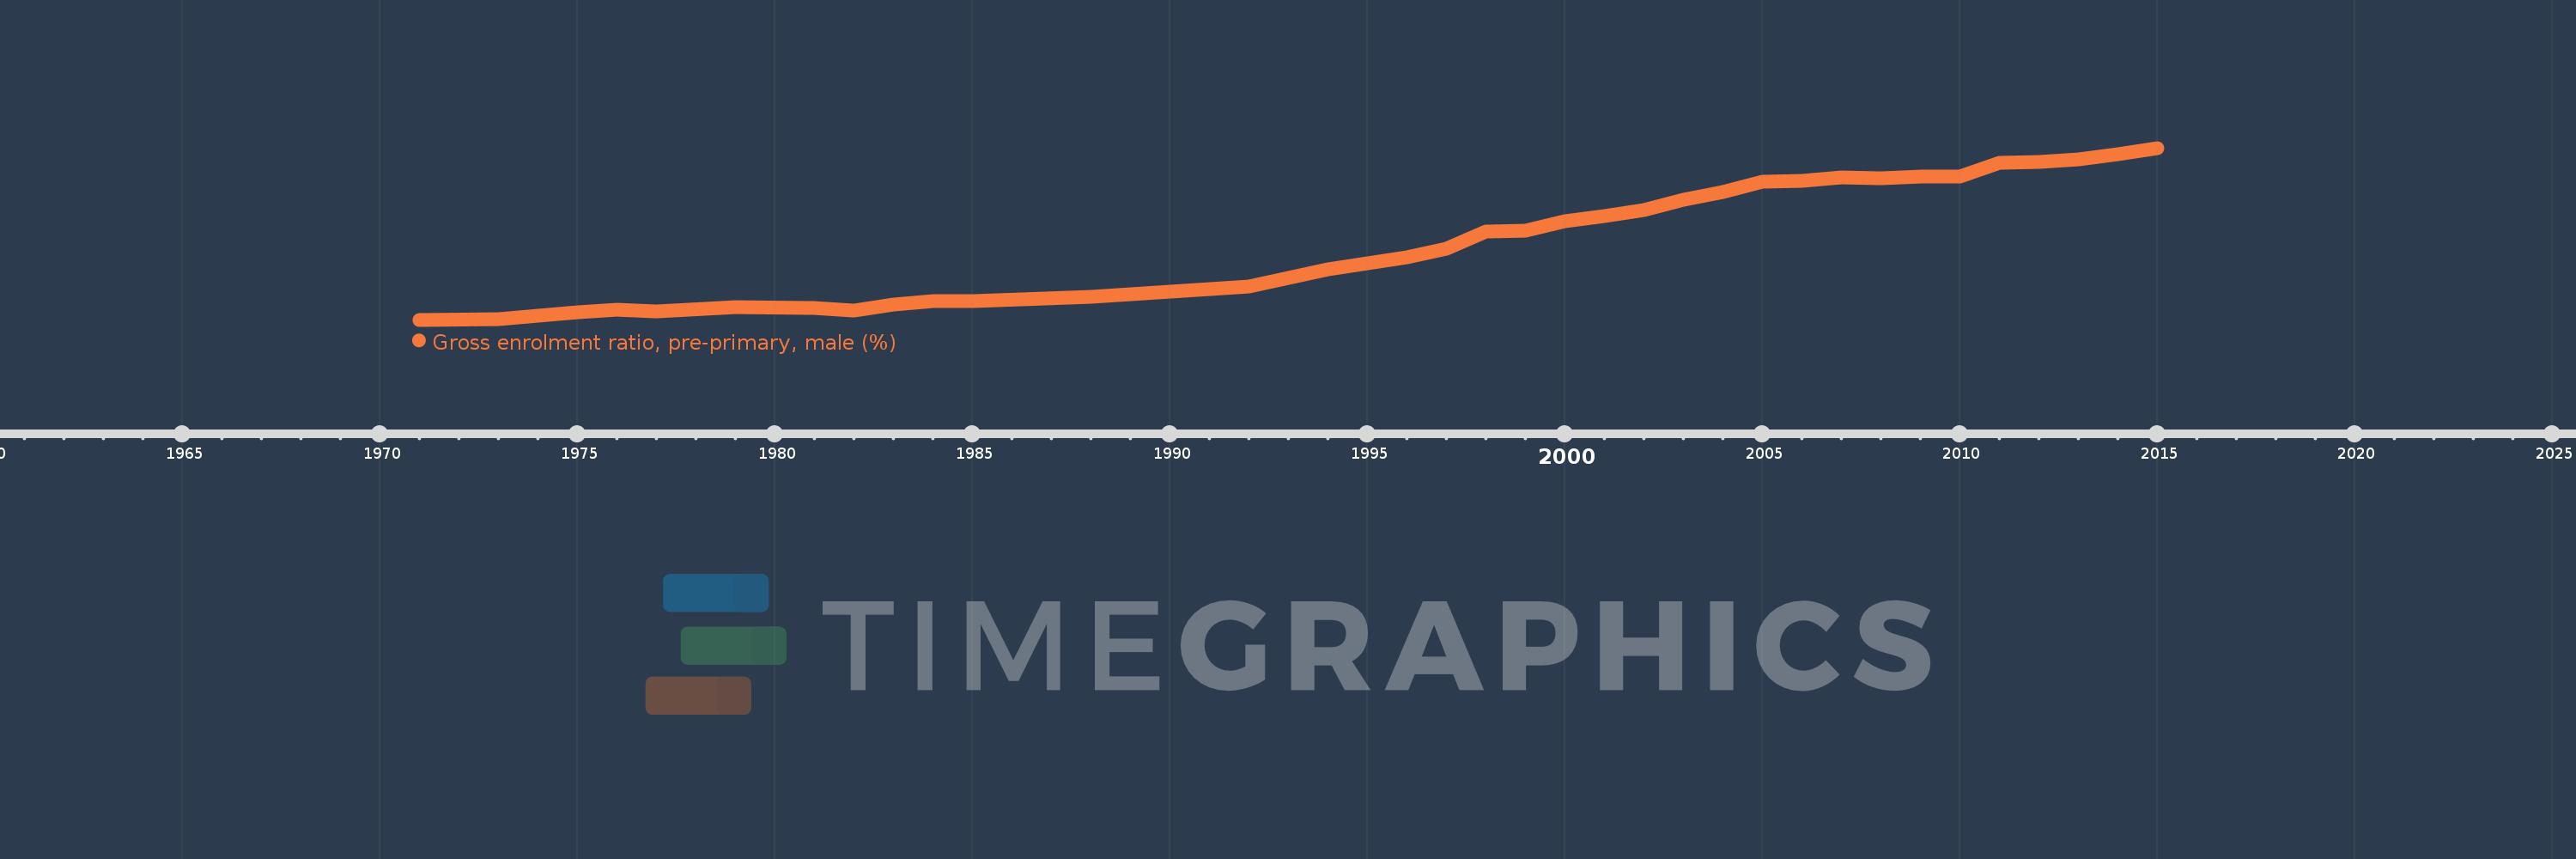
Gross enrolment ratio, pre-primary, male (%)
2015,2014,2013,2012,2011,2010,2009,2008,2007,2006,2005,2004,2003,2002,2001,2000,1999,1998,1997,1996,1994,1993,1992,1989,1988,1985,1984,1983,1982,1981,1979,1977,1976,1975,1973,1971
This statistics in other country:
AfghanistanAlbaniaAlgeriaAndorraAngolaAntigua and BarbudaArab WorldArgentinaArmeniaArubaAustraliaAustriaAzerbaijanBahamas, TheBahrainBangladeshBarbadosBelarusBelgiumBelizeBeninBermudaBhutanBoliviaBosnia and HerzegovinaBotswanaBrazilBrunei DarussalamBulgariaBurkina FasoBurundiCabo VerdeCambodiaCameroonCanadaCaribbean small statesCentral African RepublicCentral Europe and the BalticsChadChileChinaColombiaComorosCongo, Dem. Rep.Congo, Rep.Costa RicaCote d'IvoireCroatiaCubaCyprusCzech RepublicDenmarkDjiboutiDominicaDominican RepublicEarly-demographic dividendEast Asia & PacificEast Asia & Pacific (excluding high income)East Asia & Pacific (IDA & IBRD countries)EcuadorEgypt, Arab Rep.El SalvadorEquatorial GuineaEritreaEstoniaEthiopiaEuro areaEurope & Central AsiaEurope & Central Asia (excluding high income)Europe & Central Asia (IDA & IBRD countries)European UnionFijiFinlandFragile and conflict affected situationsFranceGabonGambia, TheGeorgiaGermanyGhanaGreeceGrenadaGuatemalaGuineaGuinea-BissauGuyanaHeavily indebted poor countries (HIPC)High incomeHondurasHong Kong SAR, ChinaHungaryIBRD onlyIcelandIDA & IBRD totalIDA blendIDA onlyIDA totalIndiaIndonesiaIran, Islamic Rep.IraqIrelandIsraelItalyJamaicaJapanJordanKazakhstanKenyaKorea, Dem. People’s Rep.Korea, Rep.KuwaitKyrgyz RepublicLao PDRLate-demographic dividendLatin America & Caribbean Latin America & Caribbean (excluding high income)Latin America & the Caribbean (IDA & IBRD countries)LatviaLeast developed countries: UN classificationLebanonLesothoLiberiaLibyaLiechtensteinLithuaniaLow & middle incomeLow incomeLower middle incomeLuxembourgMacao SAR, ChinaMacedonia, FYRMadagascarMaldivesMaliMaltaMarshall IslandsMauritaniaMauritiusMexicoMicronesia, Fed. Sts.Middle East & North AfricaMiddle East & North Africa (excluding high income)Middle East & North Africa (IDA & IBRD countries)Middle incomeMoldovaMongoliaMontenegroMoroccoMozambiqueMyanmarNamibiaNauruNepalNetherlandsNew ZealandNicaraguaNigerNigeriaNorth AmericaNorwayOECD membersOmanOther small statesPacific island small statesPakistanPalauPanamaPapua New GuineaParaguayPeruPhilippinesPolandPortugalPost-demographic dividendPre-demographic dividendPuerto RicoQatarRomaniaRussian FederationRwandaSamoaSan MarinoSao Tome and PrincipeSaudi ArabiaSenegalSerbiaSeychellesSierra LeoneSlovak RepublicSloveniaSmall statesSolomon IslandsSomaliaSouth AfricaSouth AsiaSouth Asia (IDA & IBRD)South SudanSpainSri LankaSt. Kitts and NevisSt. LuciaSt. Vincent and the GrenadinesSub-Saharan Africa Sub-Saharan Africa (excluding high income)Sub-Saharan Africa (IDA & IBRD countries)SudanSurinameSwazilandSwedenSwitzerlandSyrian Arab RepublicTajikistanTanzaniaThailandTimor-LesteTogoTongaTrinidad and TobagoTunisiaTurkeyTurkmenistanTuvaluUgandaUkraineUnited Arab EmiratesUnited KingdomUnited StatesUpper middle incomeUruguayUzbekistanVanuatuVenezuela, RBVietnamWest Bank and GazaWorldYemen, Rep.Zimbabwe Timeline:
This timeline shows a graph from 1971 to 2015 of El Salvador. No data until 1970. Number of actual observations by date: 36.
Source name:
World Development Indicators
Source organization:
UNESCO Institute for Statistics
Categories, topics:
Education, Gender
Last updated:
apr 23, 2017
Indicators value changes by year
At the date of observation
Value
Absolute change
Change from previous value
jan 1, 1971
6.382
+6.382
0.0%
jan 1, 1973
6.64
+0.259
4.05%
jan 1, 1975
9.248
+2.607
39.26%
jan 1, 1976
10.274
+1.026
11.1%
jan 1, 1977
9.469
-0.805
-7.84%
jan 1, 1979
11.034
+1.566
16.54%
jan 1, 1981
10.909
-0.126
-1.14%
jan 1, 1982
9.893
-1.015
-9.31%
jan 1, 1983
12.138
+2.244
22.68%
jan 1, 1984
13.307
+1.17
9.64%
jan 1, 1985
13.301
-0.006
-0.05%
jan 1, 1988
15.019
+1.718
12.91%
jan 1, 1989
15.985
+0.966
6.43%
jan 1, 1992
18.821
+2.837
17.75%
jan 1, 1993
21.977
+3.156
16.77%
jan 1, 1994
25.255
+3.278
14.91%
jan 1, 1996
29.694
+4.439
17.58%
jan 1, 1997
33.123
+3.429
11.55%
jan 1, 1998
39.244
+6.122
18.48%
jan 1, 1999
39.872
+0.628
1.6%
jan 1, 2000
43.377
+3.505
8.79%
jan 1, 2001
45.093
+1.716
3.96%
jan 1, 2002
47.473
+2.381
5.28%
jan 1, 2003
51.184
+3.71
7.82%
jan 1, 2004
54.293
+3.11
6.08%
jan 1, 2005
58.02
+3.727
6.86%
jan 1, 2006
58.531
+0.51
0.88%
jan 1, 2007
59.626
+1.095
1.87%
jan 1, 2008
59.244
-0.382
-0.64%
jan 1, 2009
59.91
+0.666
1.12%
jan 1, 2010
60.106
+0.197
0.33%
jan 1, 2011
65.014
+4.908
8.17%
jan 1, 2012
65.31
+0.296
0.46%
jan 1, 2013
66.45
+1.14
1.74%
jan 1, 2014
68.414
+1.964
2.96%
jan 1, 2015
70.69
+2.276
3.33%
Ranking of countries by current statistics by years


Comments: