29
/
en
AIzaSyAYiBZKx7MnpbEhh9jyipgxe19OcubqV5w
April 1, 2024
52067
North America
NAC
false
2
1
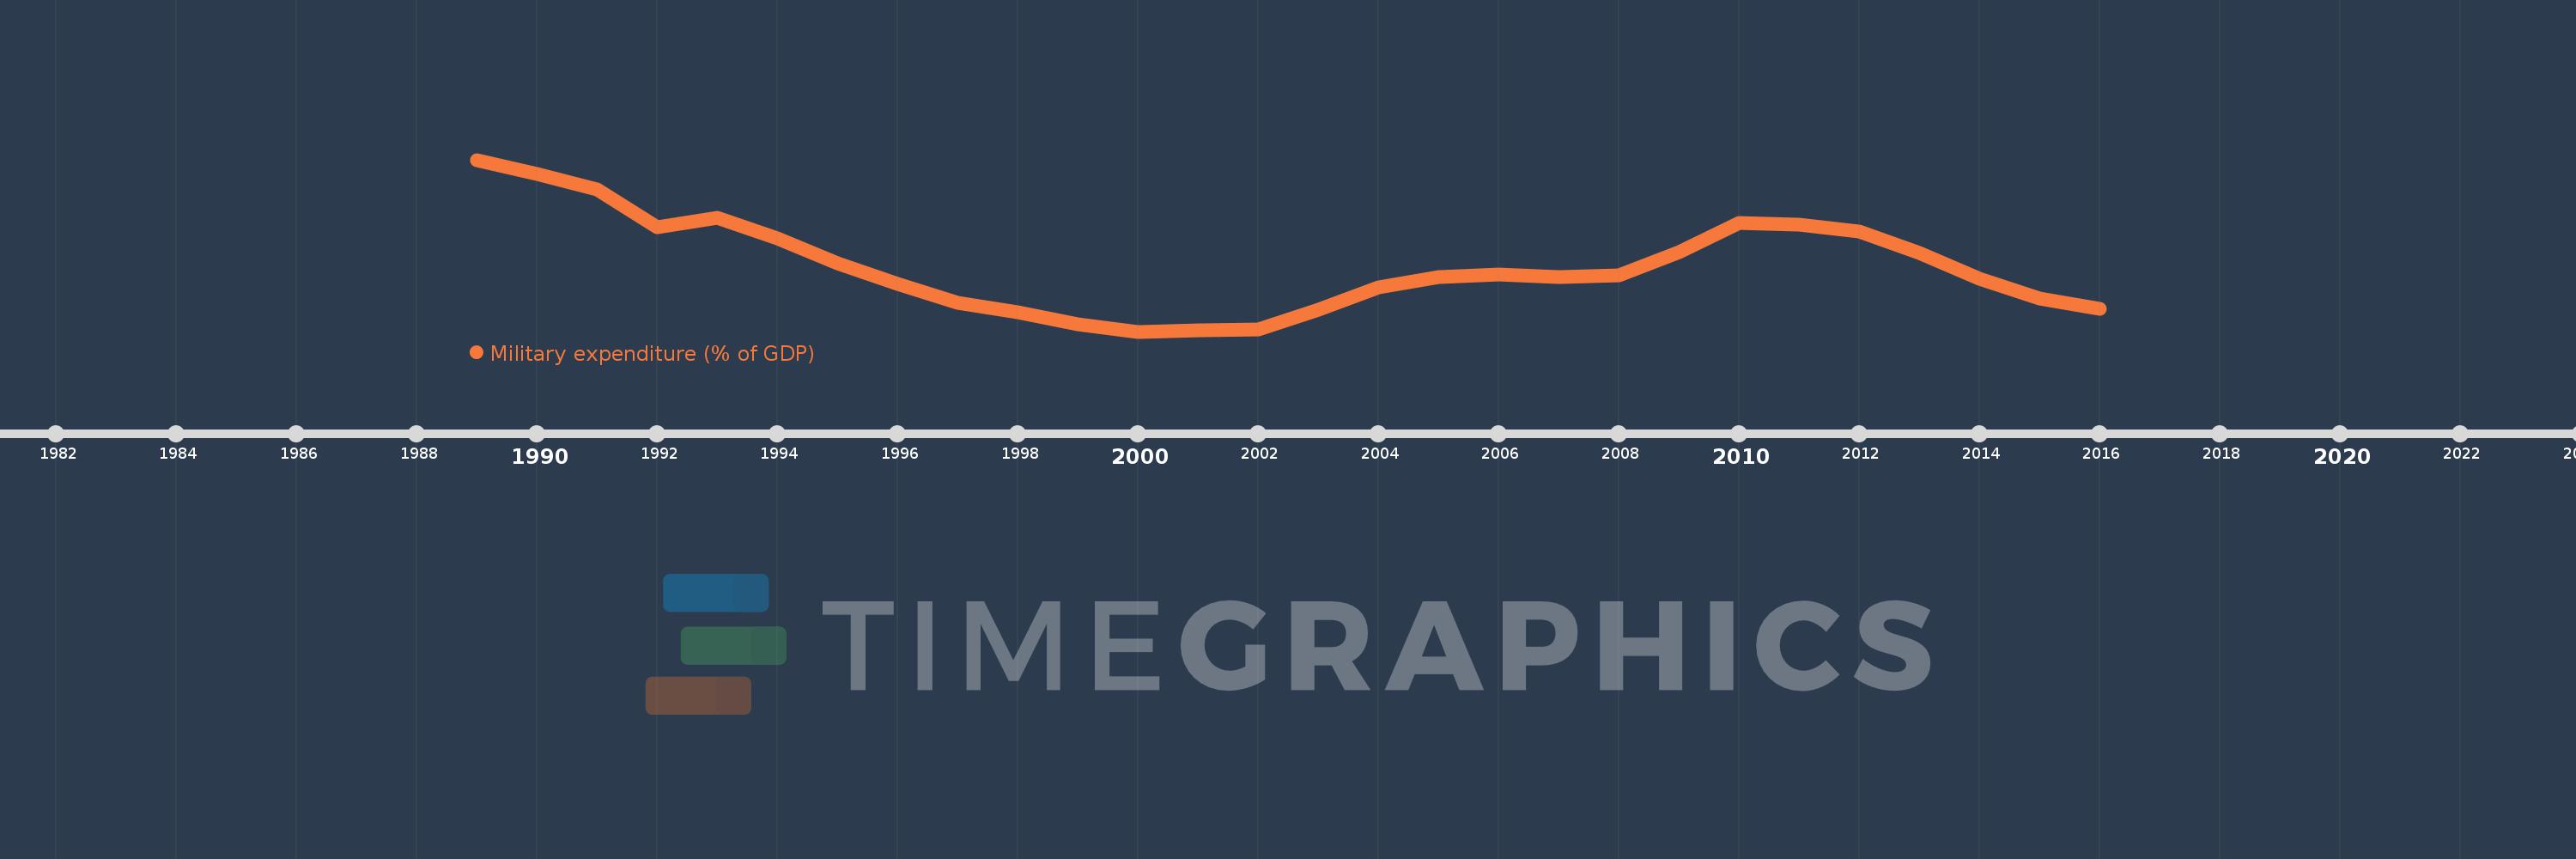
Military expenditure (% of GDP)
2016,2015,2014,2013,2012,2011,2010,2009,2008,2007,2006,2005,2004,2003,2002,2001,2000,1999,1998,1997,1996,1995,1994,1993,1992,1991,1990,1989
This statistics in other country:
Timeline:
This timeline shows a graph from 1989 to 2016 of North America. No data until 1988. Number of actual observations by date: 28.
Source name:
World Development Indicators
Source organization:
Stockholm International Peace Research Institute (SIPRI), Yearbook: Armaments, Disarmament and International Security.
Categories, topics:
Public Sector
Last updated:
apr 23, 2017
Indicators value changes by year
At the date of observation
Value
Absolute change
Change from previous value
jan 1, 1989
5.26
+5.26
0.0%
jan 1, 1990
5.059
-0.201
-3.82%
jan 1, 1991
4.831
-0.228
-4.51%
jan 1, 1992
4.299
-0.533
-11.03%
jan 1, 1993
4.43
+0.131
3.06%
jan 1, 1994
4.13
-0.3
-6.78%
jan 1, 1995
3.774
-0.356
-8.62%
jan 1, 1996
3.484
-0.29
-7.69%
jan 1, 1997
3.208
-0.276
-7.91%
jan 1, 1998
3.069
-0.139
-4.32%
jan 1, 1999
2.901
-0.168
-5.48%
jan 1, 2000
2.798
-0.104
-3.57%
jan 1, 2001
2.811
+0.014
0.49%
jan 1, 2002
2.827
+0.016
0.57%
jan 1, 2003
3.112
+0.285
10.08%
jan 1, 2004
3.428
+0.316
10.15%
jan 1, 2005
3.58
+0.152
4.42%
jan 1, 2006
3.62
+0.041
1.13%
jan 1, 2007
3.576
-0.044
-1.23%
jan 1, 2008
3.603
+0.027
0.76%
jan 1, 2009
3.937
+0.334
9.28%
jan 1, 2010
4.354
+0.417
10.59%
jan 1, 2011
4.328
-0.026
-0.6%
jan 1, 2012
4.234
-0.094
-2.18%
jan 1, 2013
3.922
-0.311
-7.36%
jan 1, 2014
3.552
-0.37
-9.43%
jan 1, 2015
3.274
-0.279
-7.85%
jan 1, 2016
3.12
-0.154
-4.7%
Ranking of countries by current statistics by years


Comments: