29
/
en
AIzaSyAYiBZKx7MnpbEhh9jyipgxe19OcubqV5w
April 1, 2024
31841
Europe & Central Asia (excluding high income)
ECA
false
2
1
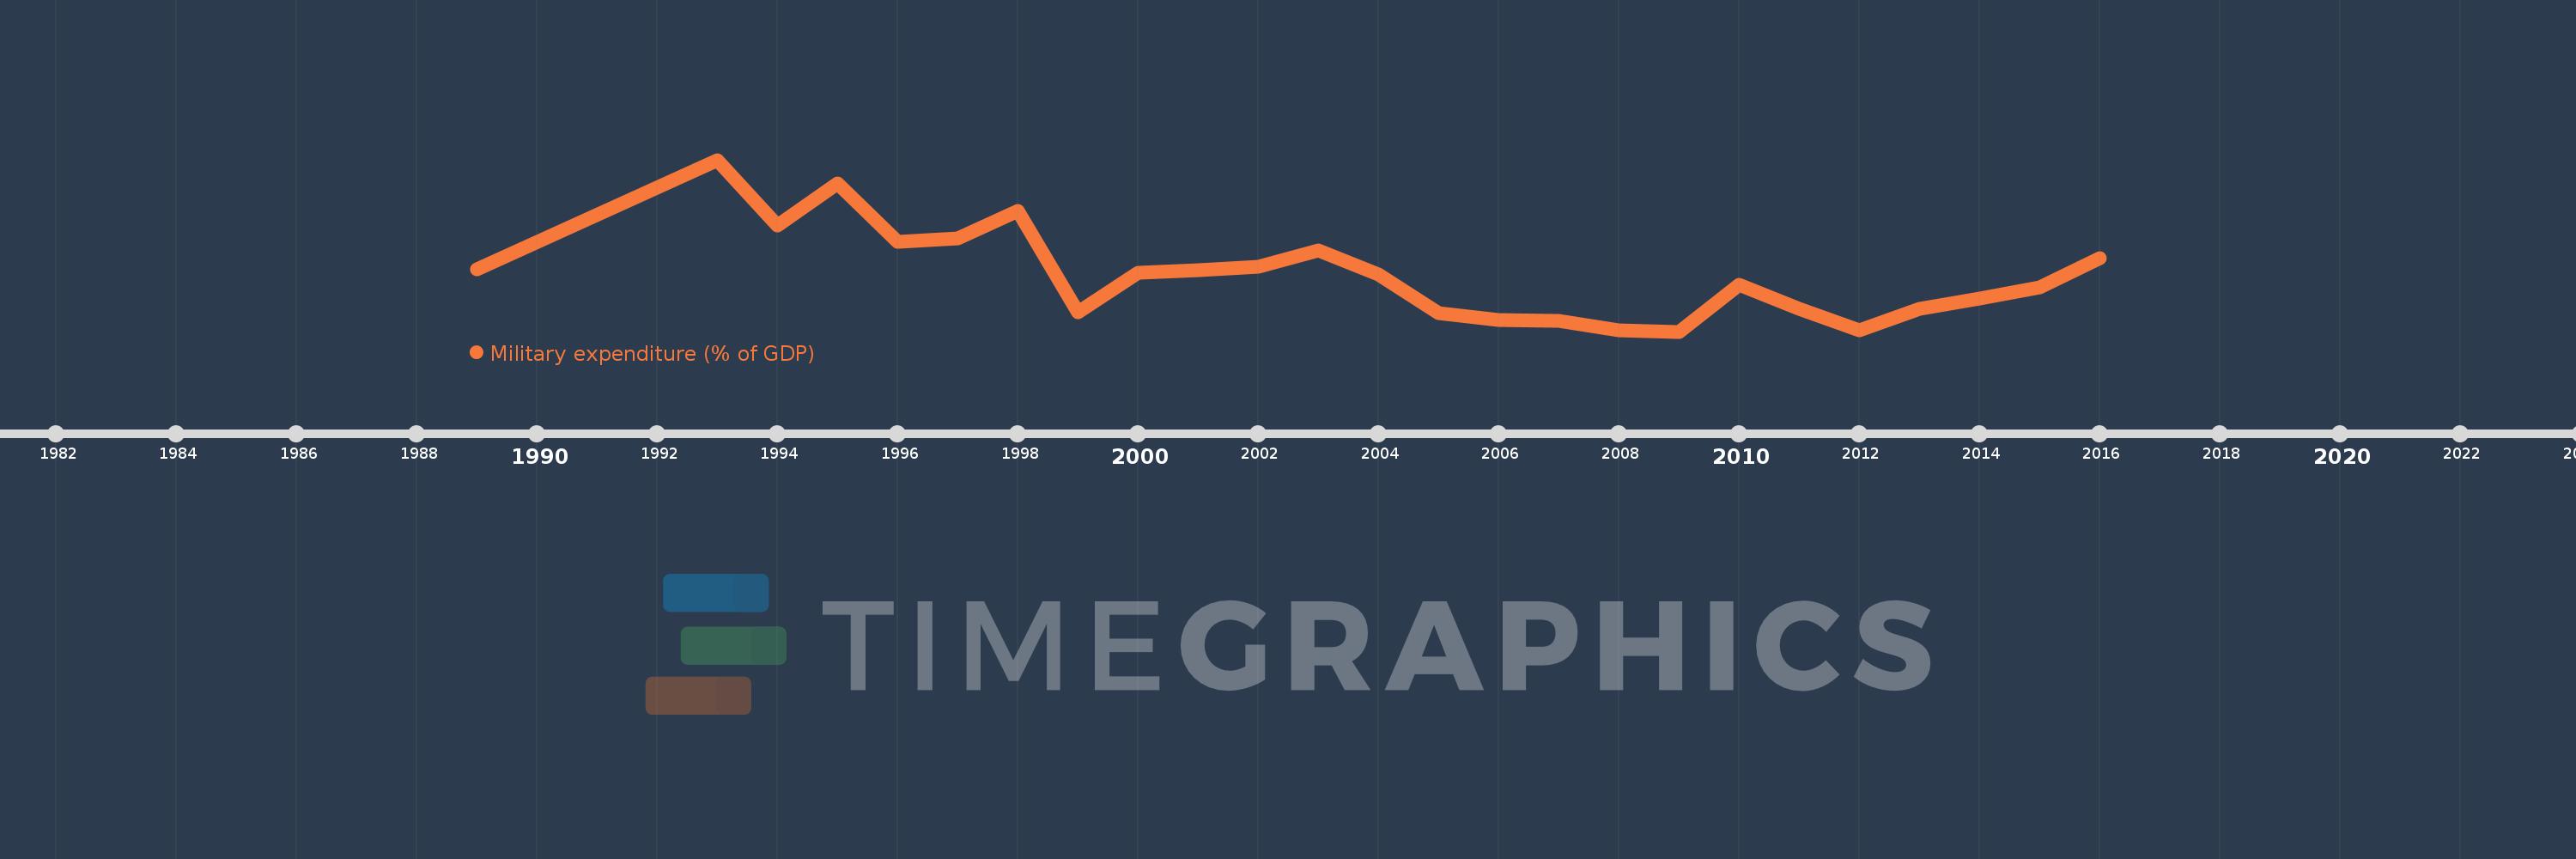
Military expenditure (% of GDP)
2016,2015,2014,2013,2012,2011,2010,2009,2008,2007,2006,2005,2004,2003,2002,2001,2000,1999,1998,1997,1996,1995,1994,1993,1989
This statistics in other country:
Timeline:
This timeline shows a graph from 1989 to 2016 of Europe & Central Asia (excluding high income). No data until 1988. Number of actual observations by date: 25.
Source name:
World Development Indicators
Source organization:
Stockholm International Peace Research Institute (SIPRI), Yearbook: Armaments, Disarmament and International Security.
Categories, topics:
Public Sector
Last updated:
apr 23, 2017
Indicators value changes by year
At the date of observation
Value
Absolute change
Change from previous value
jan 1, 1989
3.363
+3.363
0.0%
jan 1, 1993
4.38
+1.017
30.24%
jan 1, 1994
3.771
-0.609
-13.9%
jan 1, 1995
4.159
+0.388
10.29%
jan 1, 1996
3.623
-0.536
-12.88%
jan 1, 1997
3.655
+0.031
0.87%
jan 1, 1998
3.91
+0.255
6.98%
jan 1, 1999
2.969
-0.94
-24.05%
jan 1, 2000
3.332
+0.363
12.22%
jan 1, 2001
3.355
+0.022
0.67%
jan 1, 2002
3.388
+0.034
1.0%
jan 1, 2003
3.541
+0.152
4.5%
jan 1, 2004
3.319
-0.222
-6.27%
jan 1, 2005
2.962
-0.357
-10.74%
jan 1, 2006
2.9
-0.062
-2.09%
jan 1, 2007
2.885
-0.015
-0.52%
jan 1, 2008
2.797
-0.088
-3.06%
jan 1, 2009
2.789
-0.008
-0.28%
jan 1, 2010
3.221
+0.432
15.49%
jan 1, 2011
2.999
-0.221
-6.87%
jan 1, 2012
2.801
-0.199
-6.63%
jan 1, 2013
3.002
+0.201
7.18%
jan 1, 2014
3.099
+0.098
3.26%
jan 1, 2015
3.199
+0.099
3.2%
jan 1, 2016
3.471
+0.272
8.52%
Ranking of countries by current statistics by years


Comments: