29
/
en
AIzaSyAYiBZKx7MnpbEhh9jyipgxe19OcubqV5w
April 1, 2024
175608
Latvia
LVA
true
2
1
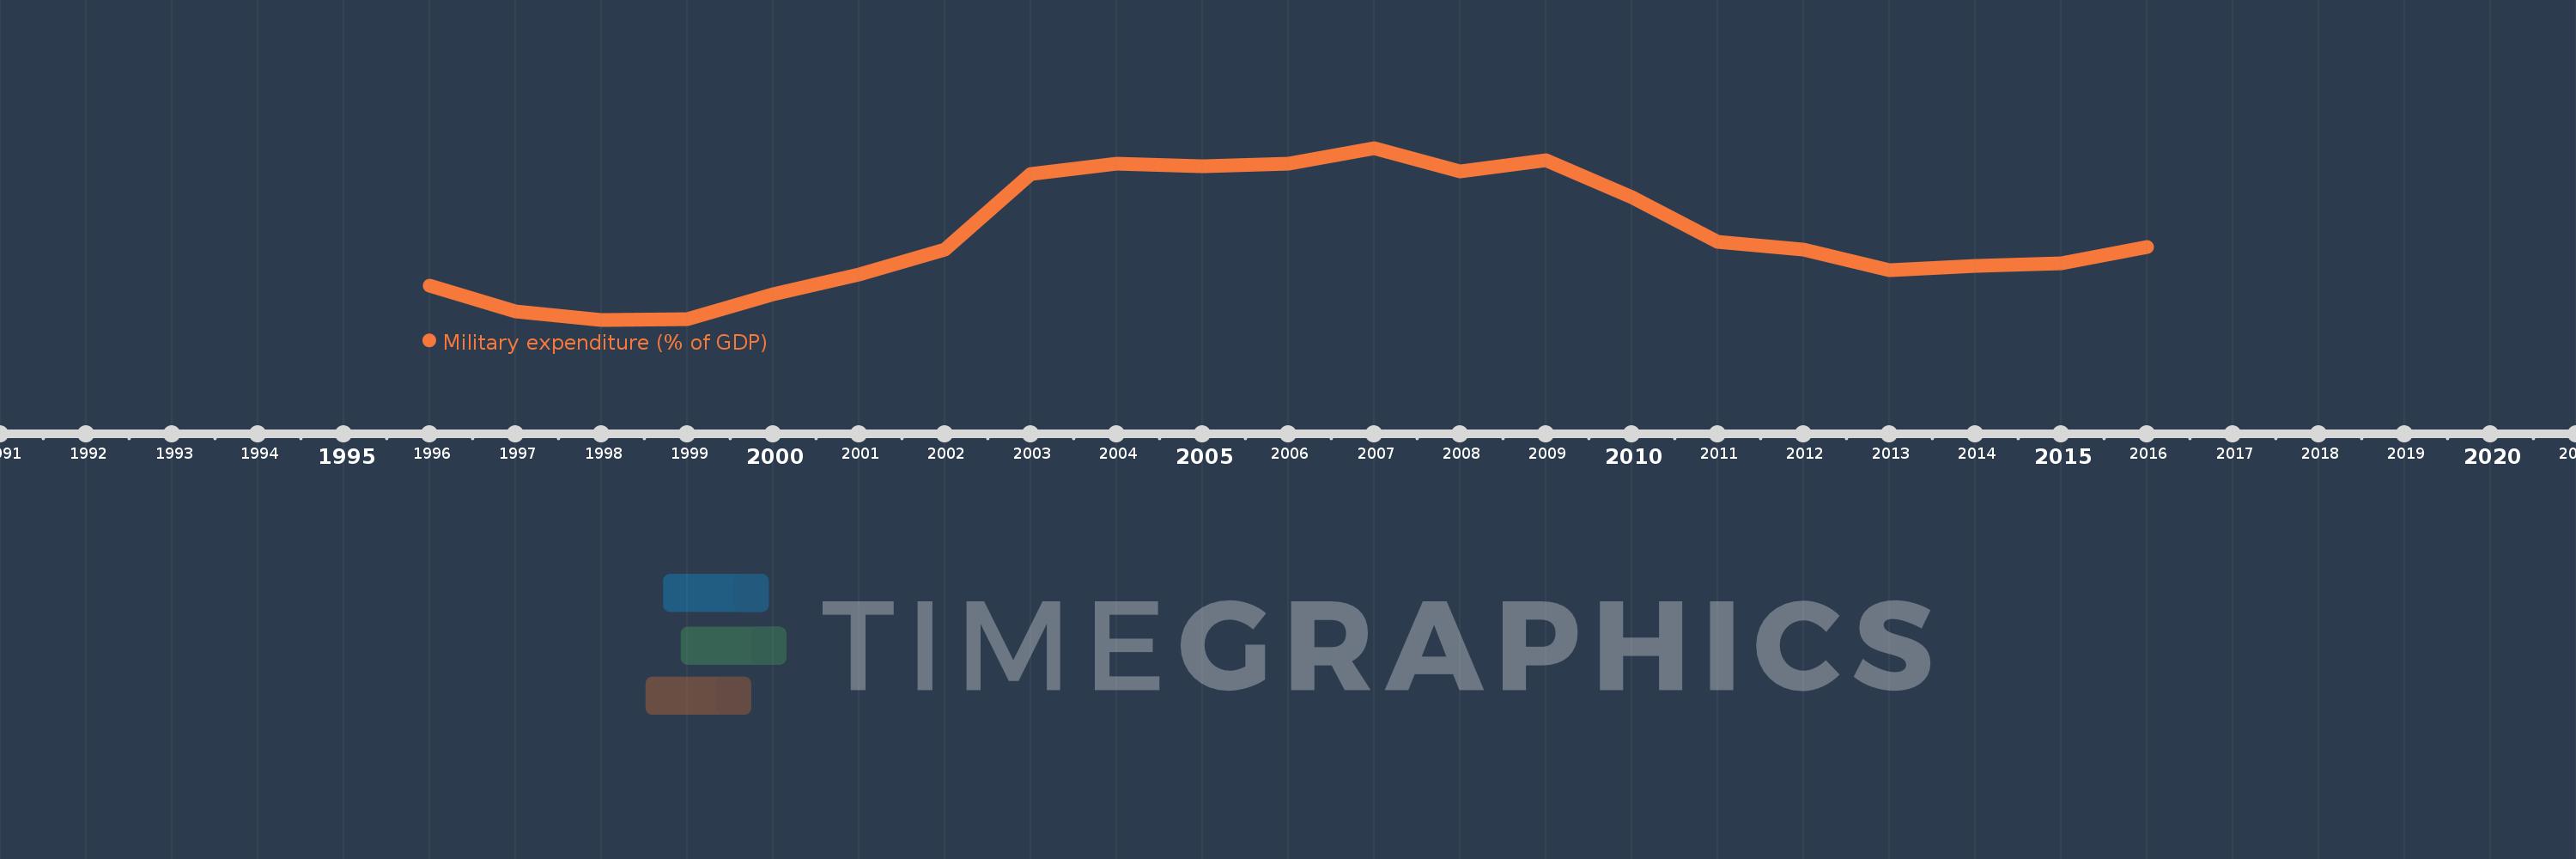
Military expenditure (% of GDP)
2016,2015,2014,2013,2012,2011,2010,2009,2008,2007,2006,2005,2004,2003,2002,2001,2000,1999,1998,1997,1996
This statistics in other country:
Timeline:
This timeline shows a graph from 1996 to 2016 of Latvia. No data until 1995. Number of actual observations by date: 21.
Source name:
World Development Indicators
Source organization:
Stockholm International Peace Research Institute (SIPRI), Yearbook: Armaments, Disarmament and International Security.
Categories, topics:
Public Sector
Last updated:
apr 23, 2017
Indicators value changes by year
At the date of observation
Value
Absolute change
Change from previous value
jan 1, 1996
0.806
+0.806
0.0%
jan 1, 1997
0.639
-0.167
-20.67%
jan 1, 1998
0.582
-0.057
-8.92%
jan 1, 1999
0.588
+0.006
0.98%
jan 1, 2000
0.751
+0.163
27.74%
jan 1, 2001
0.882
+0.131
17.41%
jan 1, 2002
1.042
+0.16
18.13%
jan 1, 2003
1.542
+0.501
48.07%
jan 1, 2004
1.61
+0.068
4.4%
jan 1, 2005
1.596
-0.014
-0.89%
jan 1, 2006
1.611
+0.015
0.94%
jan 1, 2007
1.715
+0.104
6.48%
jan 1, 2008
1.558
-0.157
-9.15%
jan 1, 2009
1.634
+0.076
4.9%
jan 1, 2010
1.39
-0.244
-14.95%
jan 1, 2011
1.093
-0.297
-21.39%
jan 1, 2012
1.044
-0.048
-4.41%
jan 1, 2013
0.911
-0.134
-12.79%
jan 1, 2014
0.938
+0.027
2.97%
jan 1, 2015
0.956
+0.018
1.93%
jan 1, 2016
1.059
+0.103
10.75%
Ranking of countries by current statistics by years


Comments: