This statistics in other country:
Timeline:
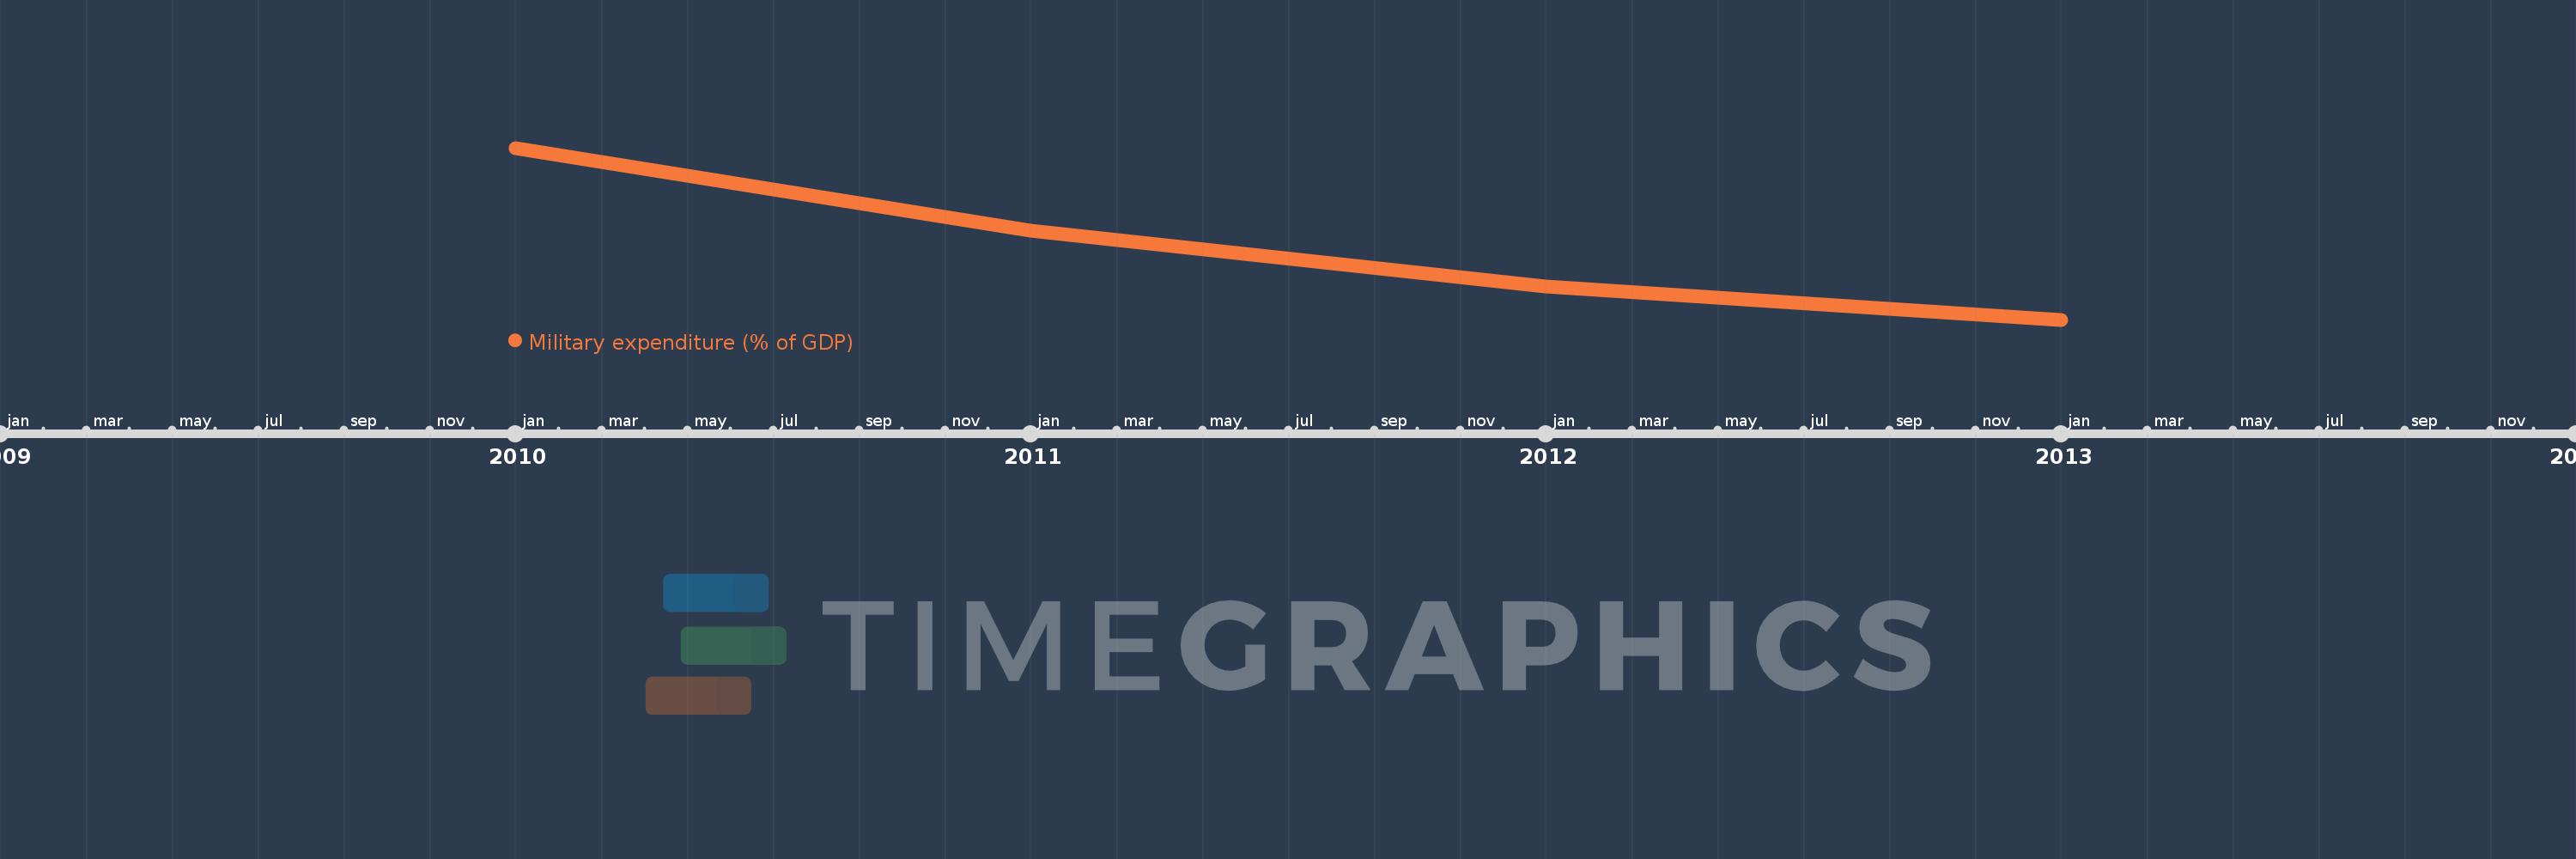
This timeline shows a graph from 2010 to 2013 of Iceland. No data until 2009. Number of actual observations by date: 4.
Source name:
World Development Indicators
Source organization:
Stockholm International Peace Research Institute (SIPRI), Yearbook: Armaments, Disarmament and International Security.
Categories, topics:
Public Sector
Last updated:
apr 23, 2017
Indicators value changes by year
At the date of observation
Value
Absolute change
Change from previous value
jan 1, 2010
0.175
+0.175
0.0%
jan 1, 2011
0.15
-0.025
-14.14%
jan 1, 2012
0.133
-0.017
-11.5%
jan 1, 2013
0.123
-0.01
-7.57%
Ranking of countries by current statistics by years


Comments: