29
/
en
AIzaSyAYiBZKx7MnpbEhh9jyipgxe19OcubqV5w
April 1, 2024
177920
Lesotho
LSO
true
2
1
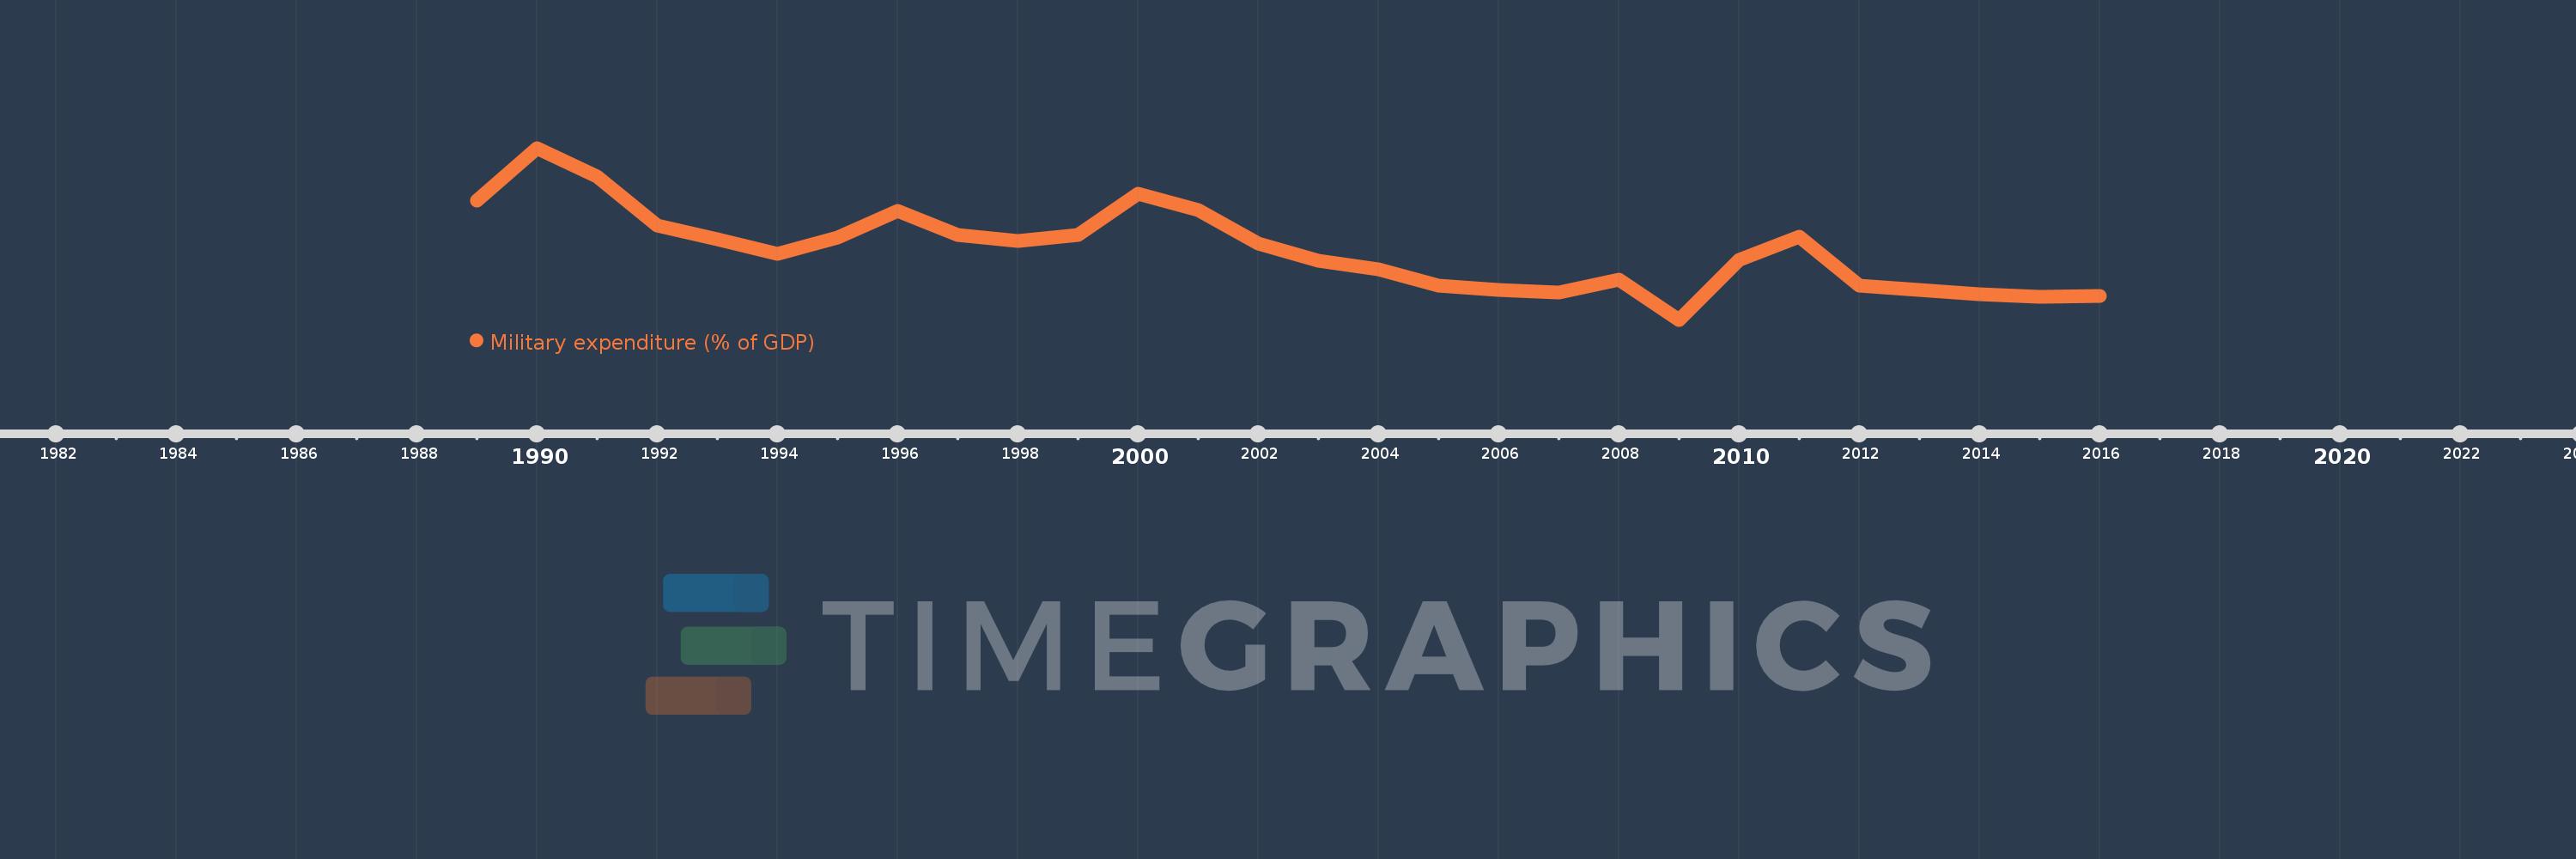
Military expenditure (% of GDP)
2016,2015,2014,2013,2012,2011,2010,2009,2008,2007,2006,2005,2004,2003,2002,2001,2000,1999,1998,1997,1996,1995,1994,1993,1992,1991,1990,1989
This statistics in other country:
Timeline:
This timeline shows a graph from 1989 to 2016 of Lesotho. No data until 1988. Number of actual observations by date: 28.
Source name:
World Development Indicators
Source organization:
Stockholm International Peace Research Institute (SIPRI), Yearbook: Armaments, Disarmament and International Security.
Categories, topics:
Public Sector
Last updated:
apr 23, 2017
Indicators value changes by year
At the date of observation
Value
Absolute change
Change from previous value
jan 1, 1989
3.605
+3.605
0.0%
jan 1, 1990
4.564
+0.959
26.61%
jan 1, 1991
4.052
-0.512
-11.22%
jan 1, 1992
3.167
-0.885
-21.83%
jan 1, 1993
2.917
-0.251
-7.92%
jan 1, 1994
2.65
-0.267
-9.15%
jan 1, 1995
2.944
+0.294
11.1%
jan 1, 1996
3.431
+0.487
16.55%
jan 1, 1997
2.996
-0.435
-12.67%
jan 1, 1998
2.876
-0.12
-4.02%
jan 1, 1999
2.995
+0.119
4.14%
jan 1, 2000
3.733
+0.739
24.66%
jan 1, 2001
3.444
-0.29
-7.76%
jan 1, 2002
2.833
-0.611
-17.74%
jan 1, 2003
2.521
-0.312
-11.0%
jan 1, 2004
2.363
-0.158
-6.26%
jan 1, 2005
2.077
-0.286
-12.12%
jan 1, 2006
1.998
-0.079
-3.78%
jan 1, 2007
1.957
-0.042
-2.08%
jan 1, 2008
2.182
+0.225
11.52%
jan 1, 2009
1.458
-0.724
-33.19%
jan 1, 2010
2.535
+1.077
73.85%
jan 1, 2011
2.954
+0.419
16.54%
jan 1, 2012
2.081
-0.873
-29.56%
jan 1, 2013
1.997
-0.084
-4.03%
jan 1, 2014
1.918
-0.079
-3.94%
jan 1, 2015
1.879
-0.04
-2.06%
jan 1, 2016
1.893
+0.014
0.77%
Ranking of countries by current statistics by years


Comments: