29
/
en
AIzaSyAYiBZKx7MnpbEhh9jyipgxe19OcubqV5w
April 1, 2024
106262
China
CHN
true
2
1
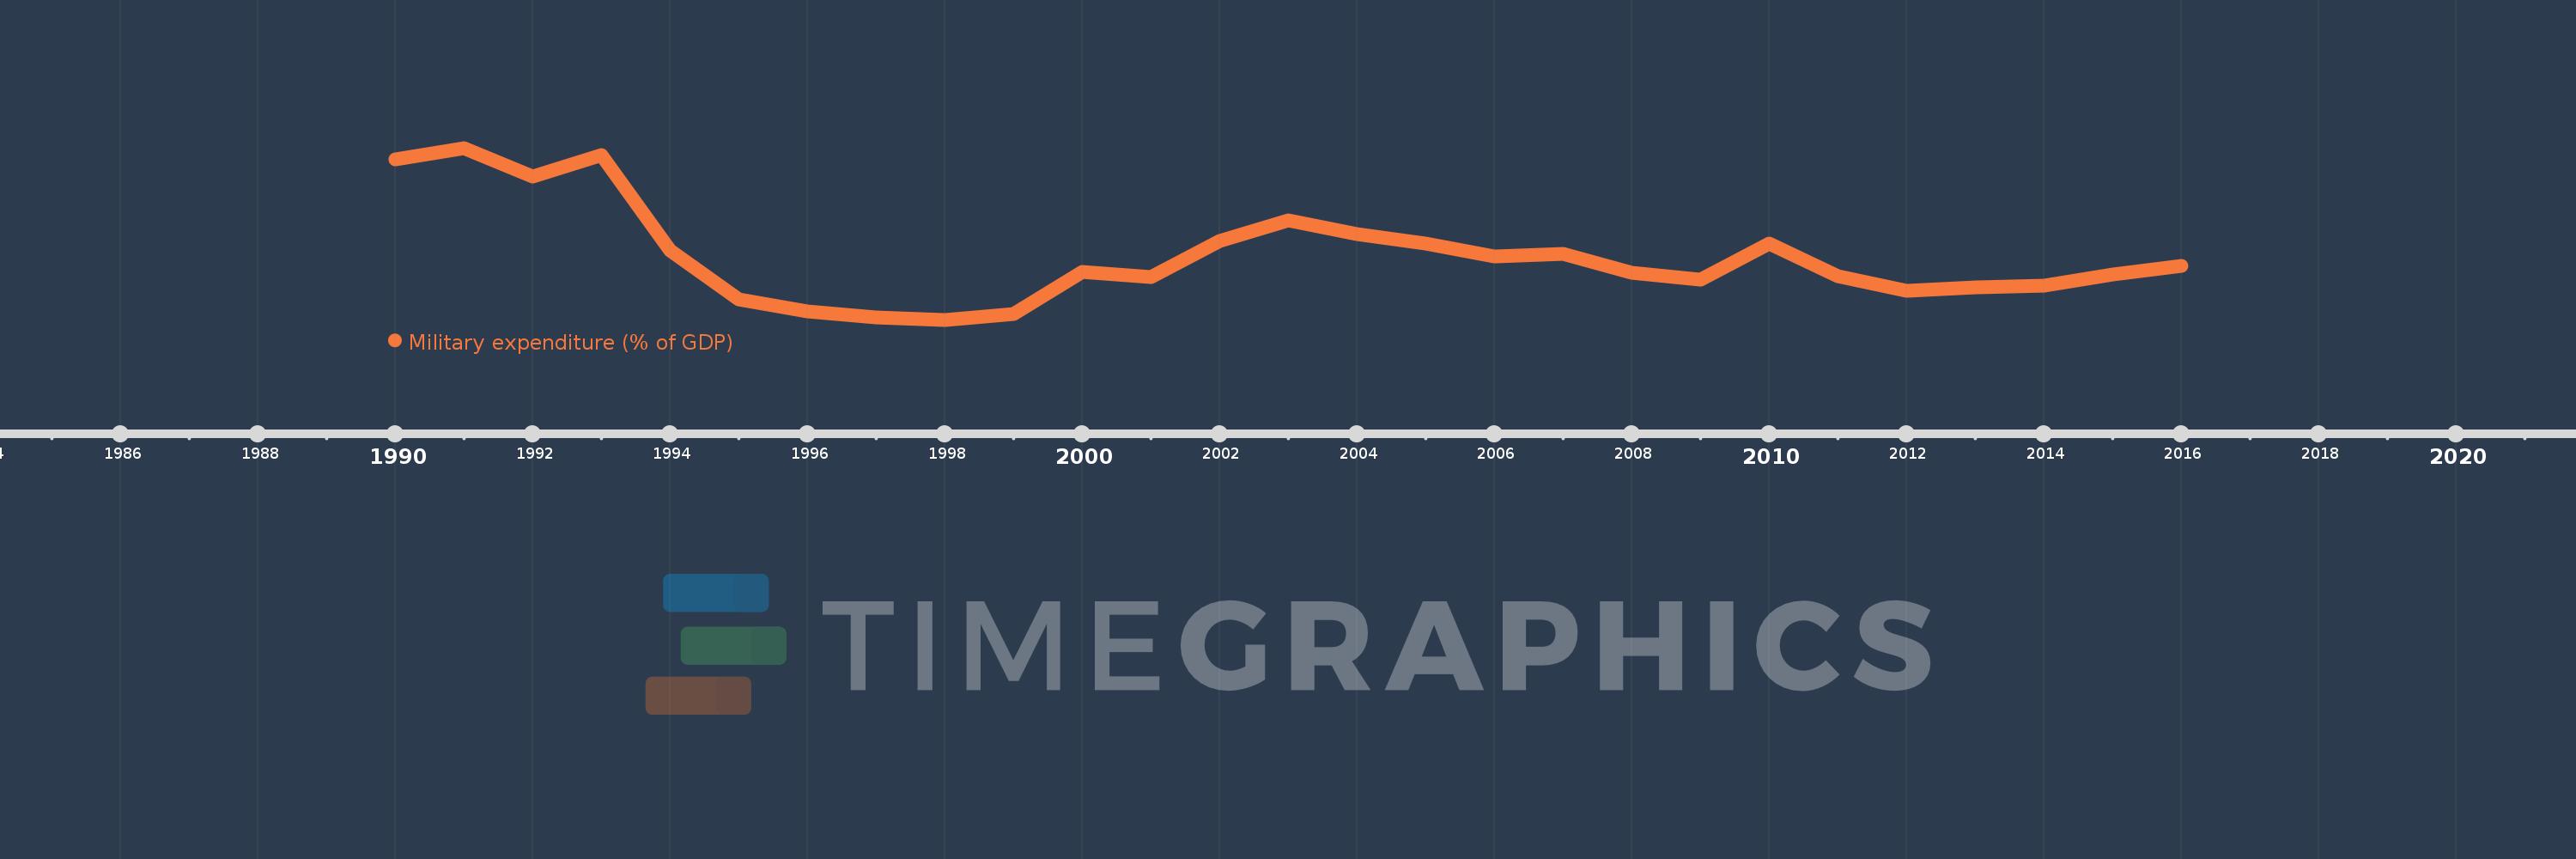
Military expenditure (% of GDP)
2016,2015,2014,2013,2012,2011,2010,2009,2008,2007,2006,2005,2004,2003,2002,2001,2000,1999,1998,1997,1996,1995,1994,1993,1992,1991,1990
This statistics in other country:
Timeline:
This timeline shows a graph from 1990 to 2016 of China. No data until 1989. Number of actual observations by date: 27.
Source name:
World Development Indicators
Source organization:
Stockholm International Peace Research Institute (SIPRI), Yearbook: Armaments, Disarmament and International Security.
Categories, topics:
Public Sector
Last updated:
apr 23, 2017
Indicators value changes by year
At the date of observation
Value
Absolute change
Change from previous value
jan 1, 1990
2.499
+2.499
0.0%
jan 1, 1991
2.556
+0.057
2.27%
jan 1, 1992
2.408
-0.148
-5.79%
jan 1, 1993
2.519
+0.111
4.6%
jan 1, 1994
2.031
-0.487
-19.34%
jan 1, 1995
1.781
-0.25
-12.33%
jan 1, 1996
1.716
-0.065
-3.63%
jan 1, 1997
1.686
-0.03
-1.76%
jan 1, 1998
1.675
-0.011
-0.67%
jan 1, 1999
1.703
+0.028
1.7%
jan 1, 2000
1.922
+0.219
12.84%
jan 1, 2001
1.893
-0.029
-1.51%
jan 1, 2002
2.081
+0.188
9.94%
jan 1, 2003
2.185
+0.104
5.01%
jan 1, 2004
2.116
-0.07
-3.19%
jan 1, 2005
2.064
-0.052
-2.46%
jan 1, 2006
2.0
-0.063
-3.07%
jan 1, 2007
2.011
+0.01
0.51%
jan 1, 2008
1.917
-0.094
-4.67%
jan 1, 2009
1.879
-0.038
-1.96%
jan 1, 2010
2.067
+0.188
10.0%
jan 1, 2011
1.897
-0.171
-8.26%
jan 1, 2012
1.822
-0.075
-3.93%
jan 1, 2013
1.839
+0.017
0.95%
jan 1, 2014
1.851
+0.012
0.65%
jan 1, 2015
1.905
+0.053
2.89%
jan 1, 2016
1.951
+0.046
2.43%
Ranking of countries by current statistics by years


Comments: