29
/
en
AIzaSyAYiBZKx7MnpbEhh9jyipgxe19OcubqV5w
April 1, 2024
236071
Senegal
SEN
true
2
1
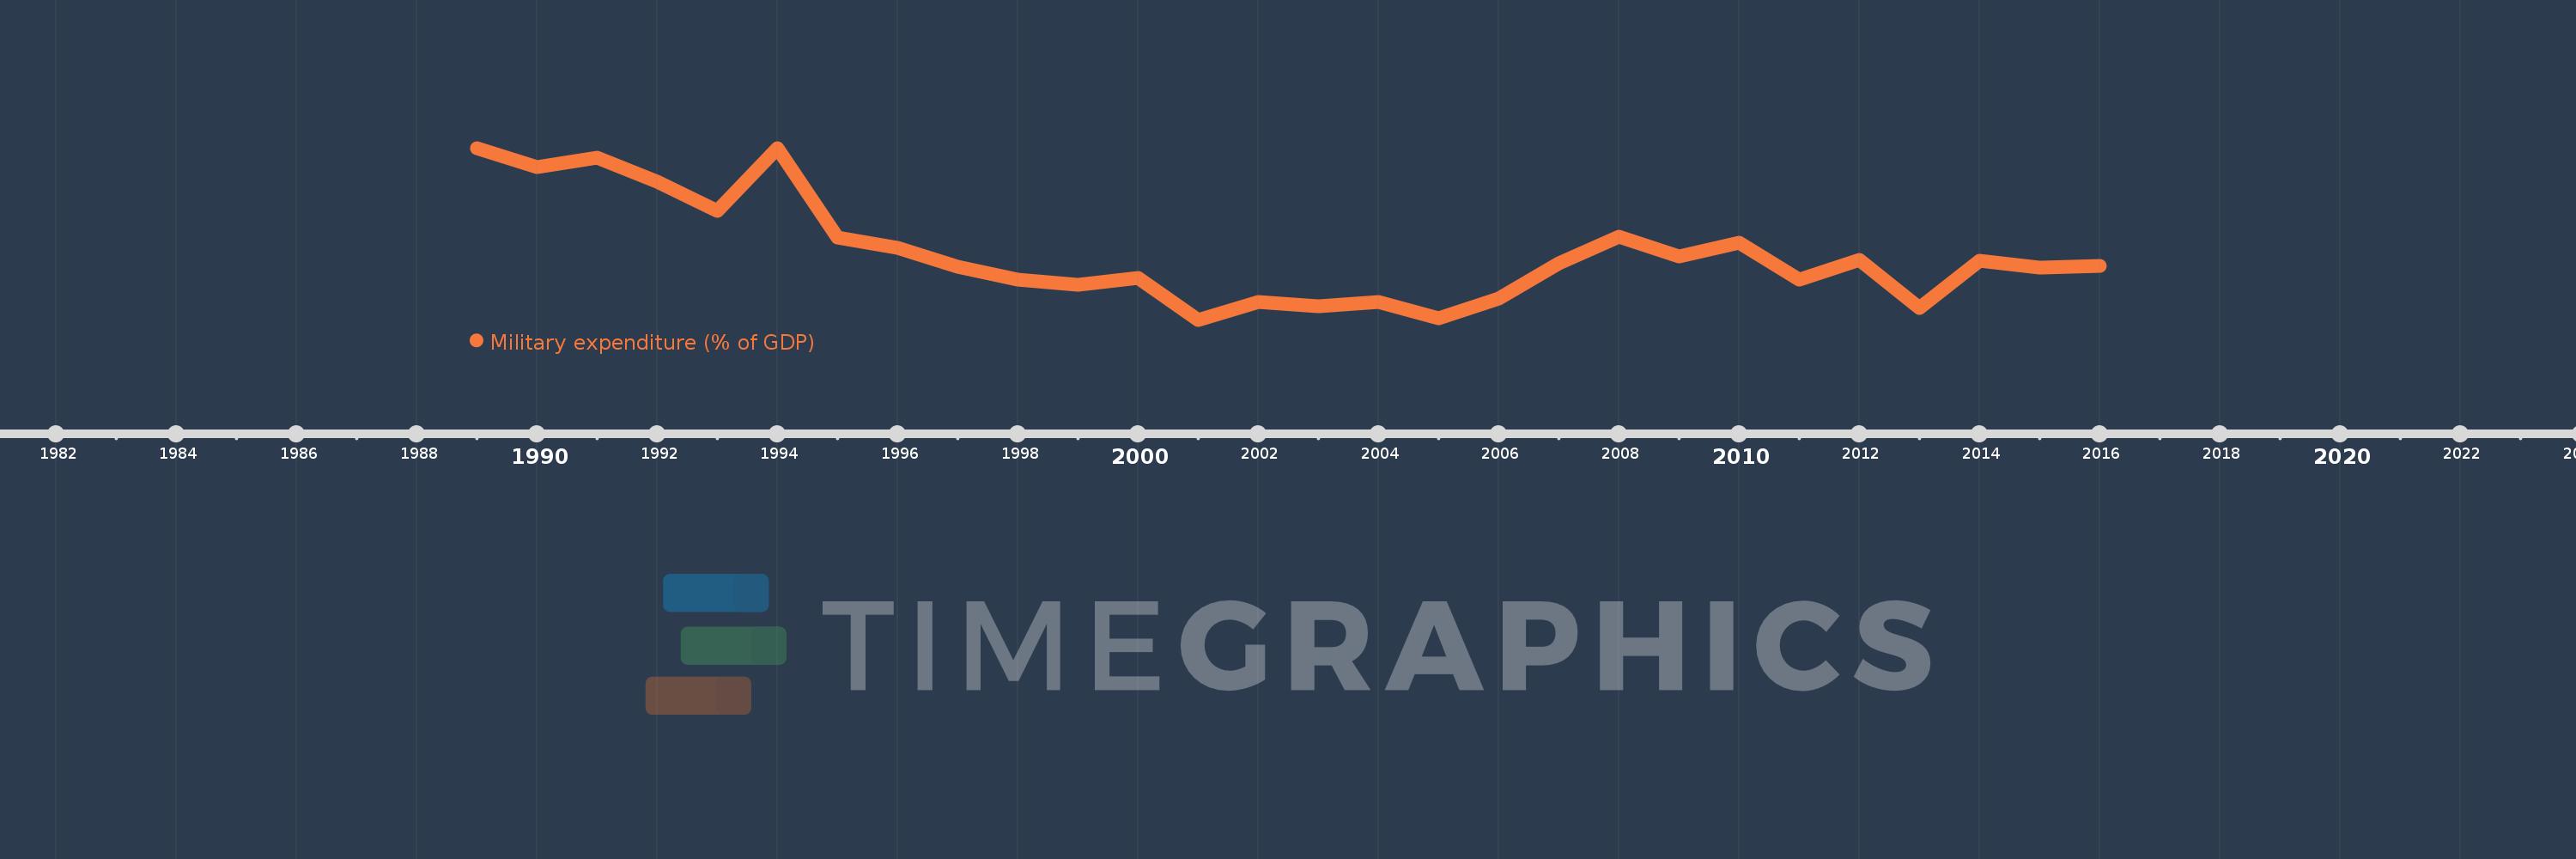
Military expenditure (% of GDP)
2016,2015,2014,2013,2012,2011,2010,2009,2008,2007,2006,2005,2004,2003,2002,2001,2000,1999,1998,1997,1996,1995,1994,1993,1992,1991,1990,1989
This statistics in other country:
Timeline:
This timeline shows a graph from 1989 to 2016 of Senegal. No data until 1988. Number of actual observations by date: 28.
Source name:
World Development Indicators
Source organization:
Stockholm International Peace Research Institute (SIPRI), Yearbook: Armaments, Disarmament and International Security.
Categories, topics:
Public Sector
Last updated:
apr 23, 2017
Indicators value changes by year
At the date of observation
Value
Absolute change
Change from previous value
jan 1, 1989
2.112
+2.112
0.0%
jan 1, 1990
2.027
-0.085
-4.01%
jan 1, 1991
2.068
+0.041
2.0%
jan 1, 1992
1.959
-0.109
-5.29%
jan 1, 1993
1.828
-0.13
-6.66%
jan 1, 1994
2.112
+0.284
15.53%
jan 1, 1995
1.706
-0.406
-19.22%
jan 1, 1996
1.659
-0.047
-2.78%
jan 1, 1997
1.575
-0.084
-5.05%
jan 1, 1998
1.515
-0.06
-3.78%
jan 1, 1999
1.493
-0.022
-1.48%
jan 1, 2000
1.522
+0.029
1.95%
jan 1, 2001
1.333
-0.189
-12.43%
jan 1, 2002
1.412
+0.08
5.99%
jan 1, 2003
1.394
-0.018
-1.29%
jan 1, 2004
1.412
+0.018
1.29%
jan 1, 2005
1.339
-0.073
-5.17%
jan 1, 2006
1.429
+0.09
6.69%
jan 1, 2007
1.587
+0.159
11.1%
jan 1, 2008
1.709
+0.121
7.64%
jan 1, 2009
1.621
-0.087
-5.11%
jan 1, 2010
1.682
+0.061
3.74%
jan 1, 2011
1.516
-0.166
-9.89%
jan 1, 2012
1.604
+0.088
5.82%
jan 1, 2013
1.386
-0.218
-13.62%
jan 1, 2014
1.599
+0.213
15.4%
jan 1, 2015
1.57
-0.029
-1.84%
jan 1, 2016
1.578
+0.009
0.57%
Ranking of countries by current statistics by years


Comments: