29
/
en
AIzaSyAYiBZKx7MnpbEhh9jyipgxe19OcubqV5w
April 1, 2024
281289
Venezuela, RB
VEN
true
2
1
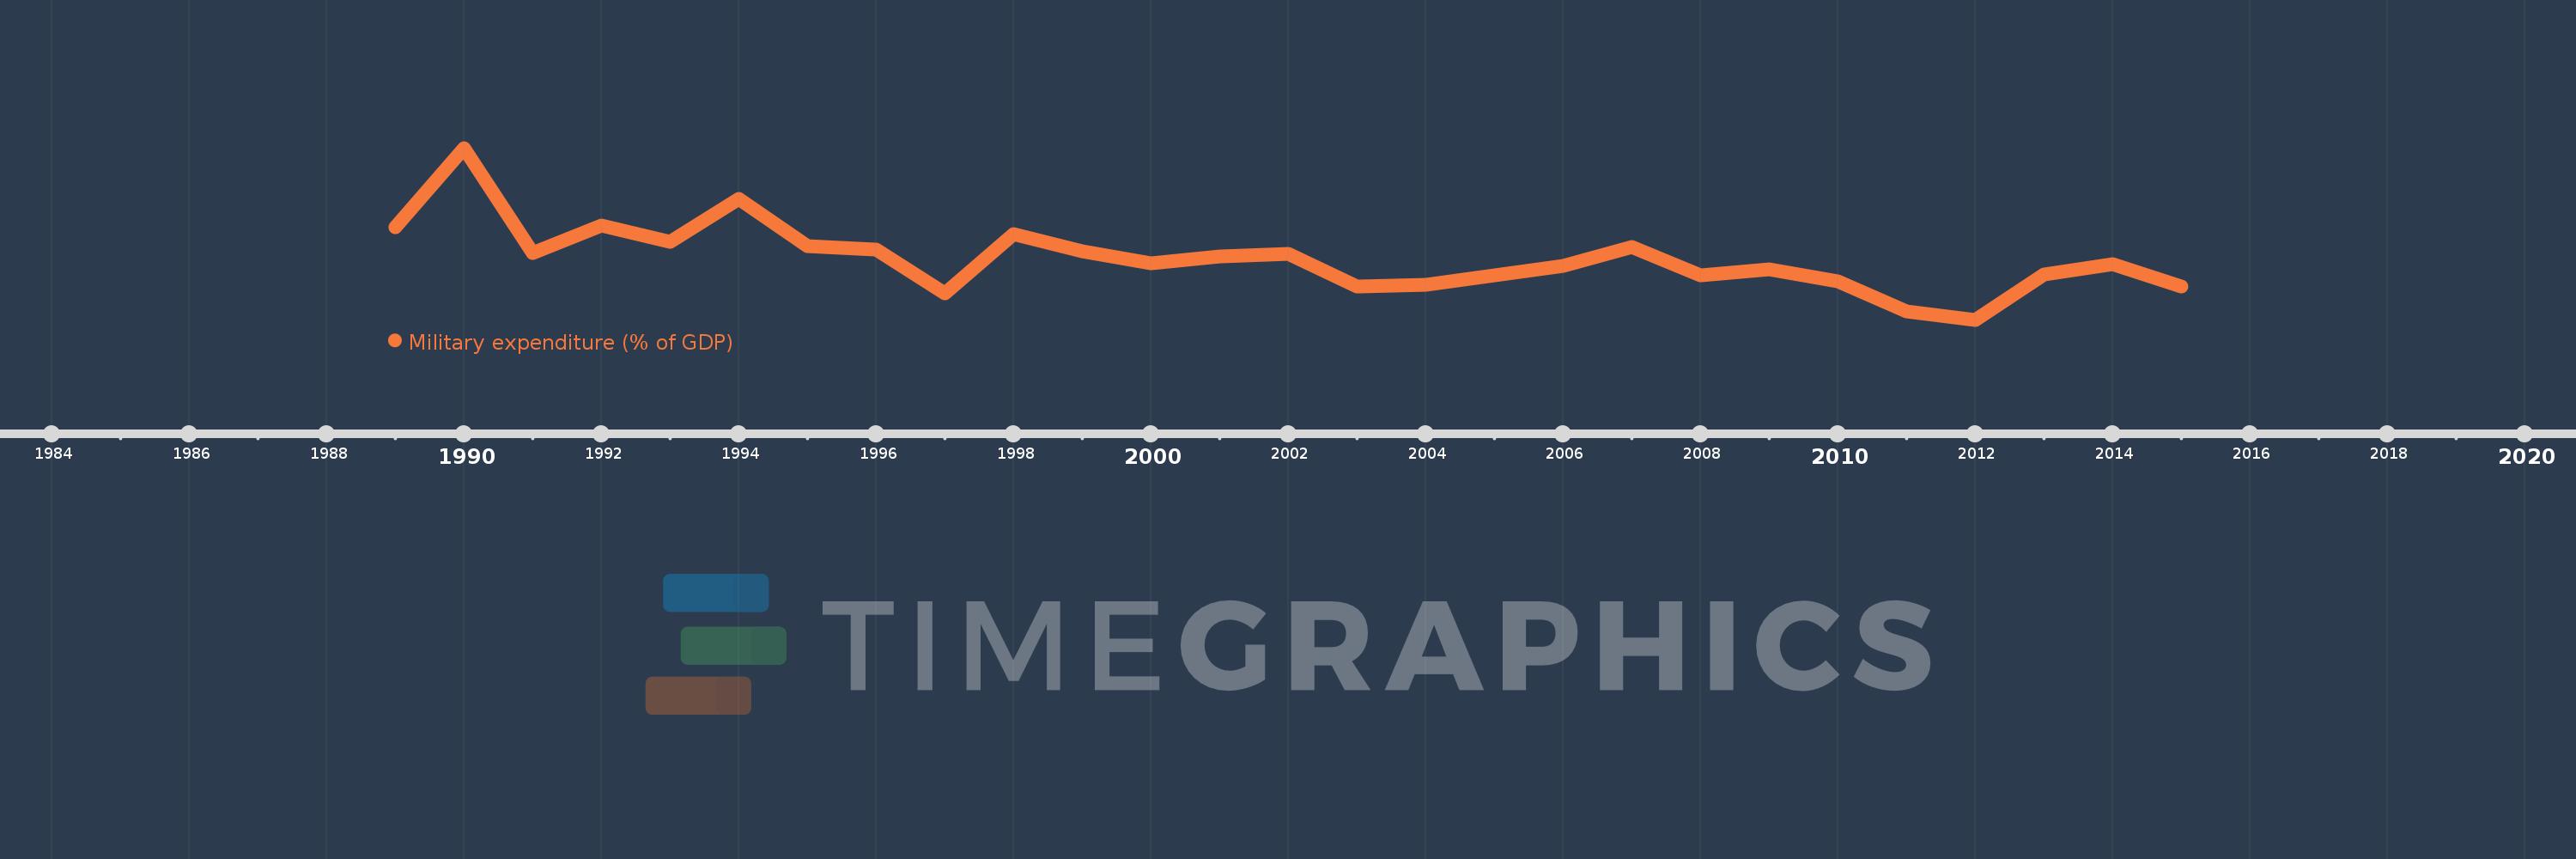
Military expenditure (% of GDP)
2015,2014,2013,2012,2011,2010,2009,2008,2007,2006,2005,2004,2003,2002,2001,2000,1999,1998,1997,1996,1995,1994,1993,1992,1991,1990,1989
This statistics in other country:
Timeline:
This timeline shows a graph from 1989 to 2015 of Venezuela, RB. No data until 1988. Number of actual observations by date: 27.
Source name:
World Development Indicators
Source organization:
Stockholm International Peace Research Institute (SIPRI), Yearbook: Armaments, Disarmament and International Security.
Categories, topics:
Public Sector
Last updated:
apr 23, 2017
Indicators value changes by year
At the date of observation
Value
Absolute change
Change from previous value
jan 1, 1989
1.877
+1.877
0.0%
jan 1, 1990
2.839
+0.963
51.3%
jan 1, 1991
1.569
-1.271
-44.75%
jan 1, 1992
1.902
+0.333
21.23%
jan 1, 1993
1.698
-0.203
-10.7%
jan 1, 1994
2.217
+0.519
30.53%
jan 1, 1995
1.644
-0.573
-25.85%
jan 1, 1996
1.601
-0.043
-2.62%
jan 1, 1997
1.074
-0.527
-32.9%
jan 1, 1998
1.795
+0.721
67.13%
jan 1, 1999
1.589
-0.207
-11.51%
jan 1, 2000
1.437
-0.151
-9.53%
jan 1, 2001
1.527
+0.089
6.22%
jan 1, 2002
1.555
+0.029
1.87%
jan 1, 2003
1.153
-0.402
-25.83%
jan 1, 2004
1.183
+0.029
2.54%
jan 1, 2005
1.288
+0.106
8.93%
jan 1, 2006
1.411
+0.123
9.56%
jan 1, 2007
1.634
+0.222
15.75%
jan 1, 2008
1.289
-0.344
-21.08%
jan 1, 2009
1.37
+0.081
6.29%
jan 1, 2010
1.22
-0.15
-10.95%
jan 1, 2011
0.854
-0.366
-30.03%
jan 1, 2012
0.754
-0.1
-11.76%
jan 1, 2013
1.302
+0.549
72.83%
jan 1, 2014
1.431
+0.129
9.87%
jan 1, 2015
1.156
-0.275
-19.21%
Ranking of countries by current statistics by years


Comments: