29
/
en
AIzaSyAYiBZKx7MnpbEhh9jyipgxe19OcubqV5w
April 1, 2024
231340
Rwanda
RWA
true
2
1
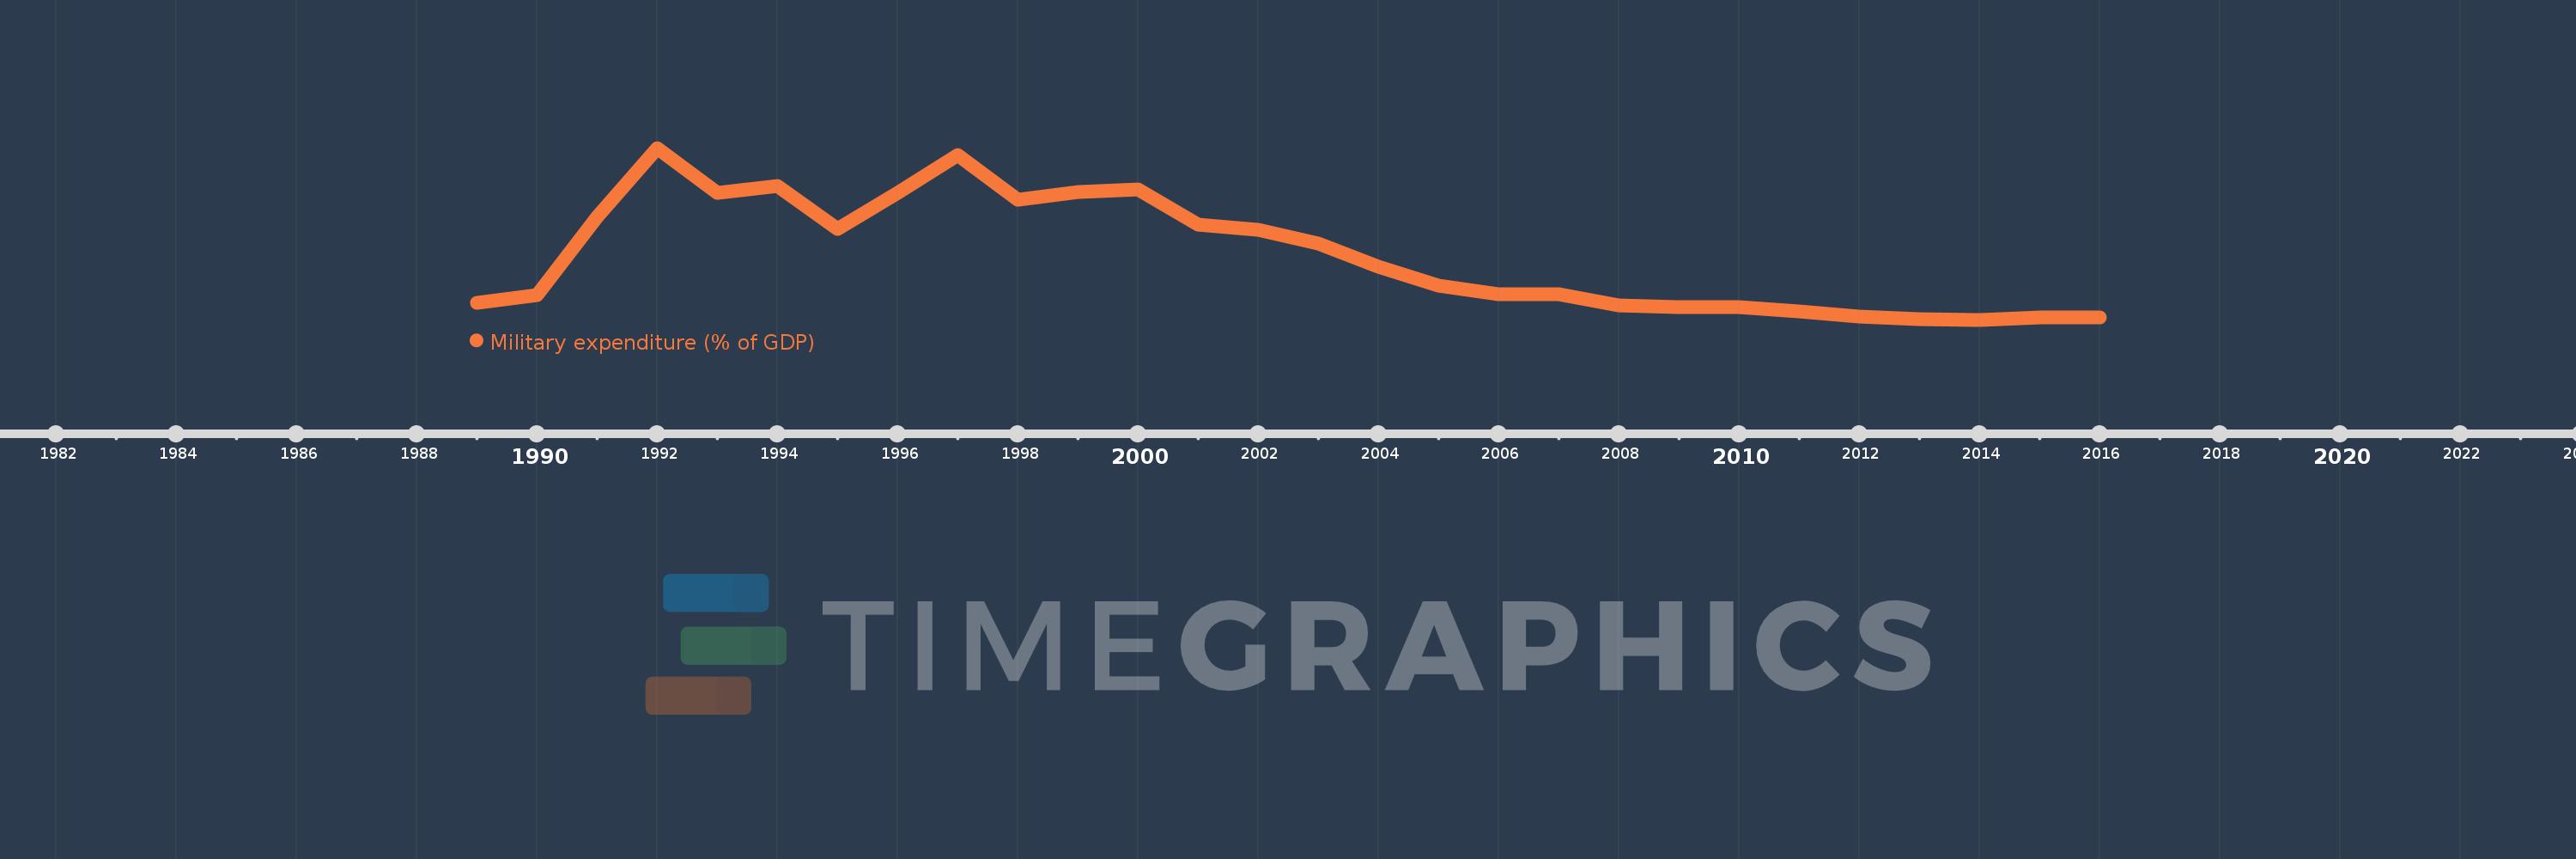
Military expenditure (% of GDP)
2016,2015,2014,2013,2012,2011,2010,2009,2008,2007,2006,2005,2004,2003,2002,2001,2000,1999,1998,1997,1996,1995,1994,1993,1992,1991,1990,1989
This statistics in other country:
Timeline:
This timeline shows a graph from 1989 to 2016 of Rwanda. No data until 1988. Number of actual observations by date: 28.
Source name:
World Development Indicators
Source organization:
Stockholm International Peace Research Institute (SIPRI), Yearbook: Armaments, Disarmament and International Security.
Categories, topics:
Public Sector
Last updated:
apr 23, 2017
Indicators value changes by year
At the date of observation
Value
Absolute change
Change from previous value
jan 1, 1989
1.529
+1.529
0.0%
jan 1, 1990
1.731
+0.202
13.19%
jan 1, 1991
3.73
+2.0
115.55%
jan 1, 1992
5.51
+1.78
47.71%
jan 1, 1993
4.365
-1.145
-20.78%
jan 1, 1994
4.536
+0.171
3.92%
jan 1, 1995
3.438
-1.099
-24.22%
jan 1, 1996
4.364
+0.926
26.94%
jan 1, 1997
5.329
+0.965
22.1%
jan 1, 1998
4.173
-1.155
-21.68%
jan 1, 1999
4.378
+0.205
4.9%
jan 1, 2000
4.448
+0.07
1.6%
jan 1, 2001
3.535
-0.913
-20.53%
jan 1, 2002
3.397
-0.138
-3.91%
jan 1, 2003
3.047
-0.349
-10.29%
jan 1, 2004
2.448
-0.599
-19.66%
jan 1, 2005
1.973
-0.476
-19.42%
jan 1, 2006
1.743
-0.23
-11.65%
jan 1, 2007
1.754
+0.011
0.63%
jan 1, 2008
1.472
-0.282
-16.07%
jan 1, 2009
1.411
-0.062
-4.18%
jan 1, 2010
1.418
+0.007
0.52%
jan 1, 2011
1.308
-0.11
-7.78%
jan 1, 2012
1.177
-0.131
-10.02%
jan 1, 2013
1.105
-0.071
-6.07%
jan 1, 2014
1.097
-0.009
-0.79%
jan 1, 2015
1.149
+0.053
4.82%
jan 1, 2016
1.156
+0.007
0.61%
Ranking of countries by current statistics by years


Comments: