29
/
en
AIzaSyAYiBZKx7MnpbEhh9jyipgxe19OcubqV5w
April 1, 2024
247828
Spain
ESP
true
2
1
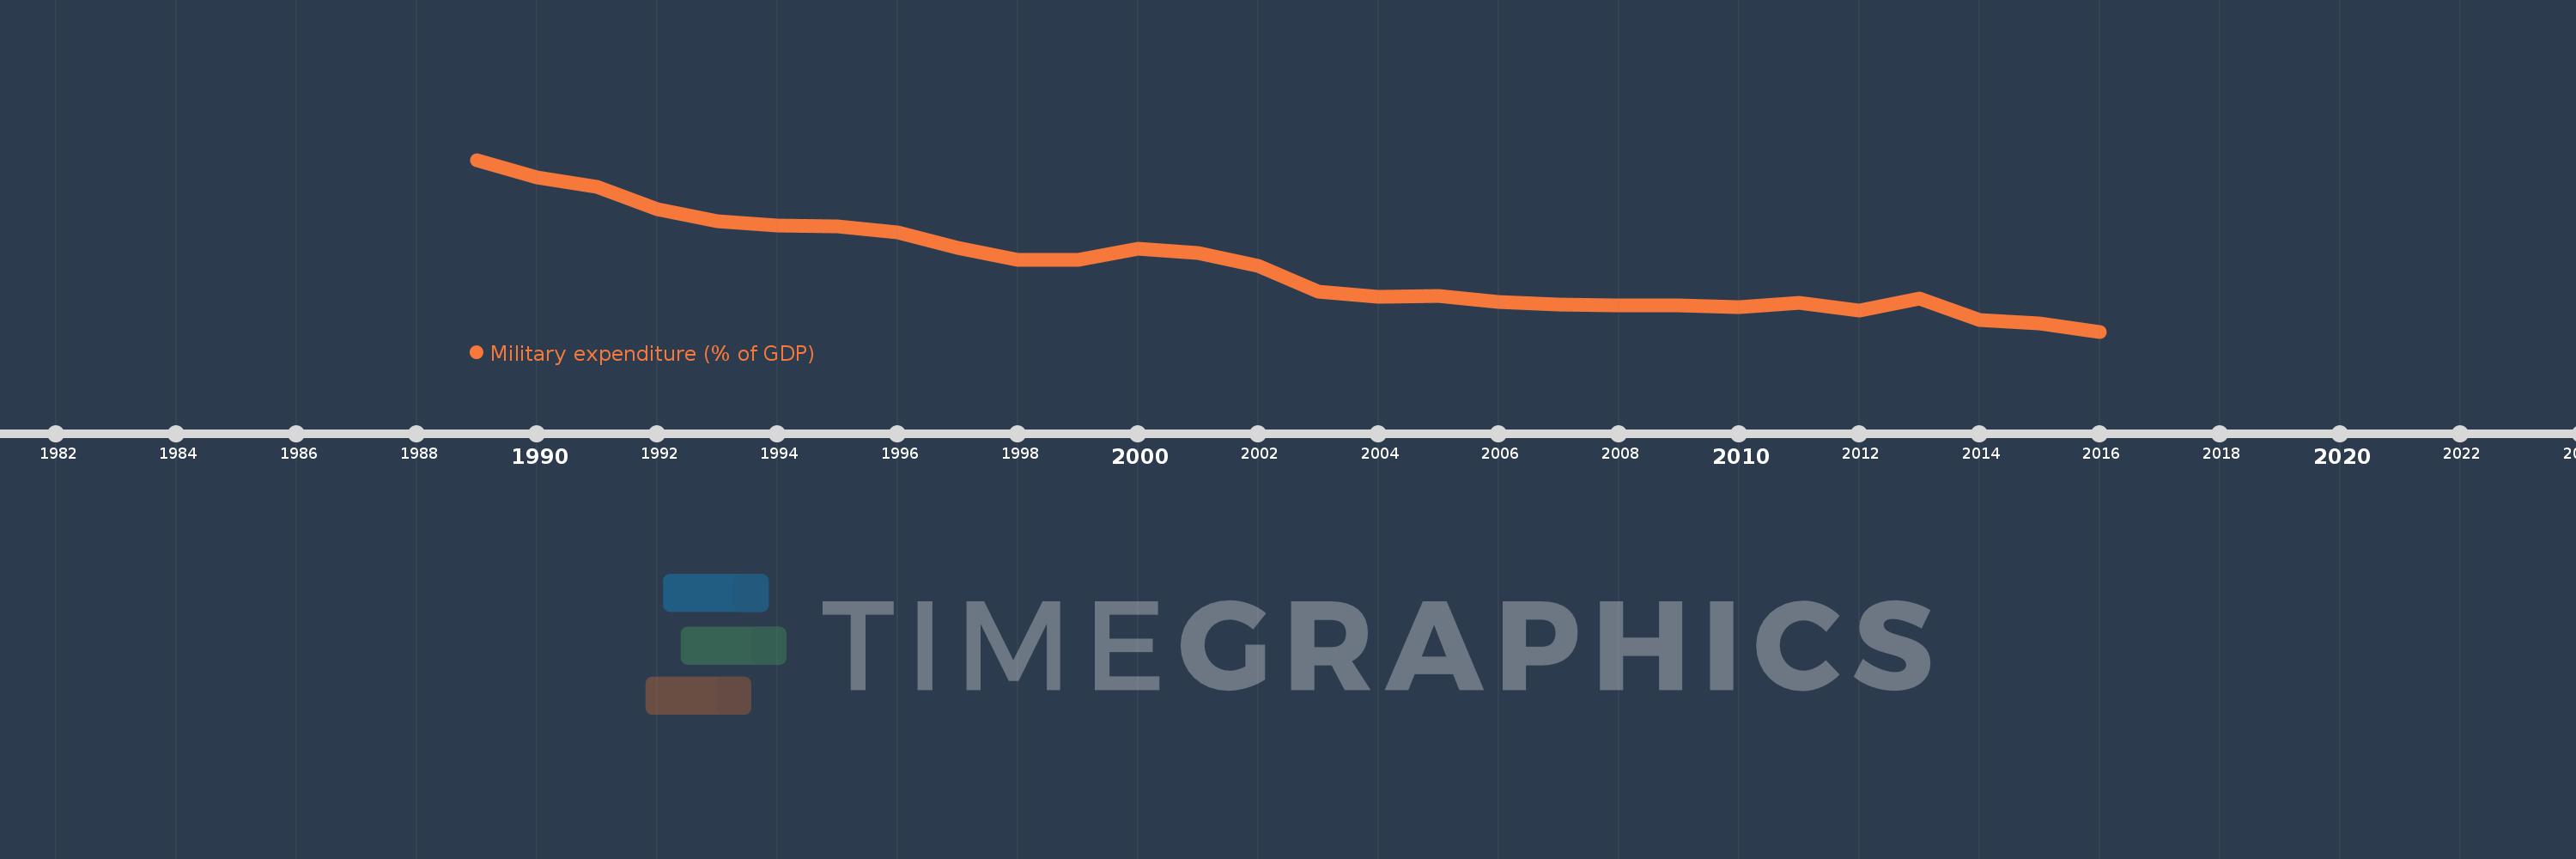
Military expenditure (% of GDP)
2016,2015,2014,2013,2012,2011,2010,2009,2008,2007,2006,2005,2004,2003,2002,2001,2000,1999,1998,1997,1996,1995,1994,1993,1992,1991,1990,1989
This statistics in other country:
Timeline:
This timeline shows a graph from 1989 to 2016 of Spain. No data until 1988. Number of actual observations by date: 28.
Source name:
World Development Indicators
Source organization:
Stockholm International Peace Research Institute (SIPRI), Yearbook: Armaments, Disarmament and International Security.
Categories, topics:
Public Sector
Last updated:
apr 23, 2017
Indicators value changes by year
At the date of observation
Value
Absolute change
Change from previous value
jan 1, 1989
2.373
+2.373
0.0%
jan 1, 1990
2.249
-0.124
-5.21%
jan 1, 1991
2.186
-0.063
-2.81%
jan 1, 1992
2.029
-0.156
-7.16%
jan 1, 1993
1.947
-0.082
-4.06%
jan 1, 1994
1.917
-0.029
-1.51%
jan 1, 1995
1.907
-0.01
-0.52%
jan 1, 1996
1.866
-0.041
-2.15%
jan 1, 1997
1.762
-0.105
-5.6%
jan 1, 1998
1.676
-0.086
-4.88%
jan 1, 1999
1.675
-0.001
-0.07%
jan 1, 2000
1.755
+0.081
4.81%
jan 1, 2001
1.726
-0.03
-1.69%
jan 1, 2002
1.633
-0.093
-5.36%
jan 1, 2003
1.456
-0.177
-10.81%
jan 1, 2004
1.42
-0.036
-2.48%
jan 1, 2005
1.427
+0.007
0.46%
jan 1, 2006
1.382
-0.045
-3.12%
jan 1, 2007
1.364
-0.018
-1.3%
jan 1, 2008
1.356
-0.008
-0.58%
jan 1, 2009
1.359
+0.003
0.22%
jan 1, 2010
1.346
-0.013
-0.98%
jan 1, 2011
1.377
+0.031
2.28%
jan 1, 2012
1.324
-0.053
-3.87%
jan 1, 2013
1.408
+0.084
6.34%
jan 1, 2014
1.259
-0.148
-10.53%
jan 1, 2015
1.234
-0.025
-1.98%
jan 1, 2016
1.176
-0.058
-4.72%
Ranking of countries by current statistics by years


Comments: