29
/
en
AIzaSyAYiBZKx7MnpbEhh9jyipgxe19OcubqV5w
April 1, 2024
238492
Seychelles
SYC
true
2
1
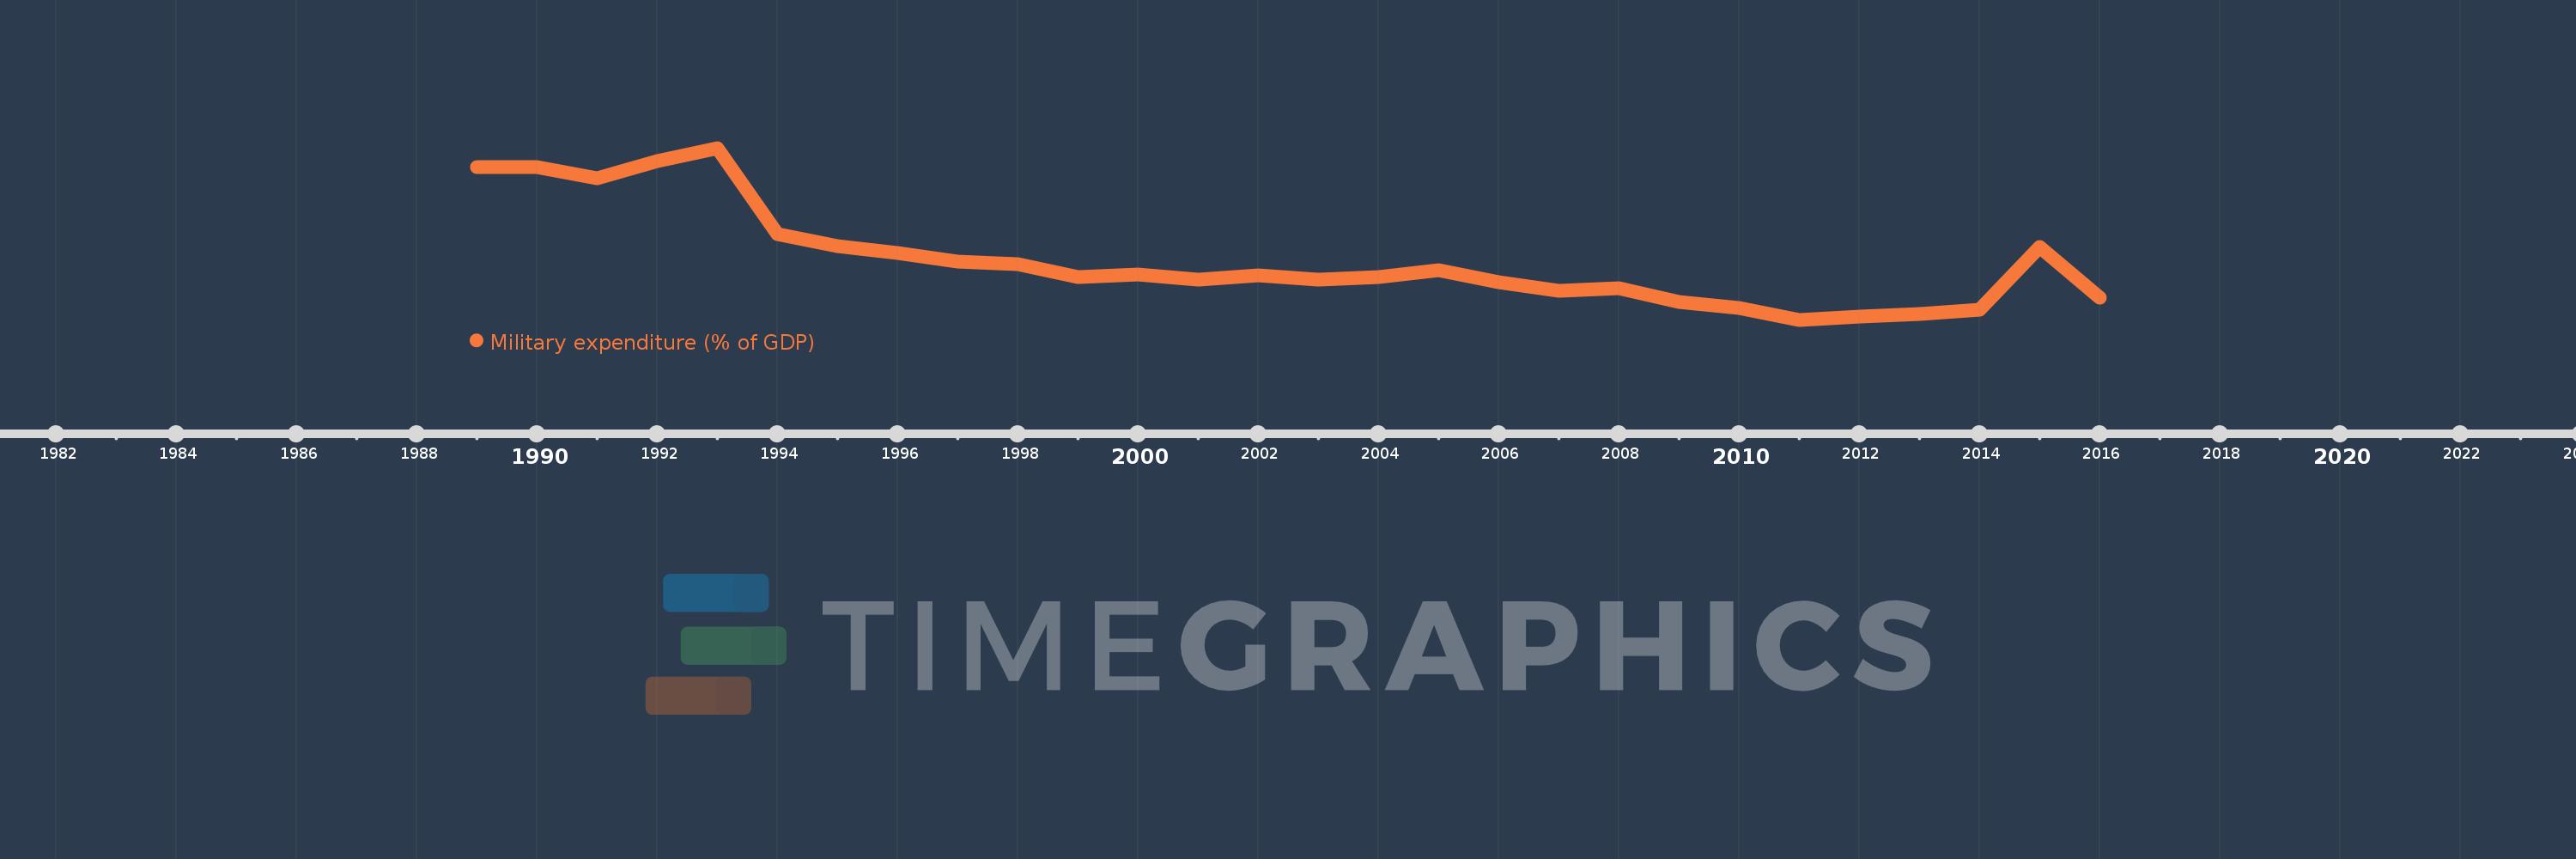
Military expenditure (% of GDP)
2016,2015,2014,2013,2012,2011,2010,2009,2008,2007,2006,2005,2004,2003,2002,2001,2000,1999,1998,1997,1996,1995,1994,1993,1992,1991,1990,1989
This statistics in other country:
Timeline:
This timeline shows a graph from 1989 to 2016 of Seychelles. No data until 1988. Number of actual observations by date: 28.
Source name:
World Development Indicators
Source organization:
Stockholm International Peace Research Institute (SIPRI), Yearbook: Armaments, Disarmament and International Security.
Categories, topics:
Public Sector
Last updated:
apr 23, 2017
Indicators value changes by year
At the date of observation
Value
Absolute change
Change from previous value
jan 1, 1989
4.28
+4.28
0.0%
jan 1, 1990
4.277
-0.003
-0.08%
jan 1, 1991
4.026
-0.25
-5.85%
jan 1, 1992
4.424
+0.398
9.88%
jan 1, 1993
4.727
+0.303
6.85%
jan 1, 1994
2.733
-1.995
-42.2%
jan 1, 1995
2.444
-0.289
-10.57%
jan 1, 1996
2.281
-0.163
-6.66%
jan 1, 1997
2.096
-0.185
-8.11%
jan 1, 1998
2.025
-0.071
-3.39%
jan 1, 1999
1.733
-0.292
-14.41%
jan 1, 2000
1.78
+0.047
2.73%
jan 1, 2001
1.679
-0.101
-5.67%
jan 1, 2002
1.778
+0.099
5.89%
jan 1, 2003
1.677
-0.101
-5.67%
jan 1, 2004
1.734
+0.057
3.39%
jan 1, 2005
1.898
+0.163
9.42%
jan 1, 2006
1.602
-0.295
-15.56%
jan 1, 2007
1.413
-0.189
-11.79%
jan 1, 2008
1.468
+0.055
3.89%
jan 1, 2009
1.15
-0.318
-21.67%
jan 1, 2010
1.021
-0.129
-11.24%
jan 1, 2011
0.738
-0.283
-27.72%
jan 1, 2012
0.817
+0.08
10.78%
jan 1, 2013
0.875
+0.057
7.03%
jan 1, 2014
0.976
+0.101
11.51%
jan 1, 2015
2.421
+1.445
148.15%
jan 1, 2016
1.257
-1.164
-48.07%
Ranking of countries by current statistics by years


Comments: