29
/
en
AIzaSyAYiBZKx7MnpbEhh9jyipgxe19OcubqV5w
April 1, 2024
226182
Portugal
PRT
true
2
1
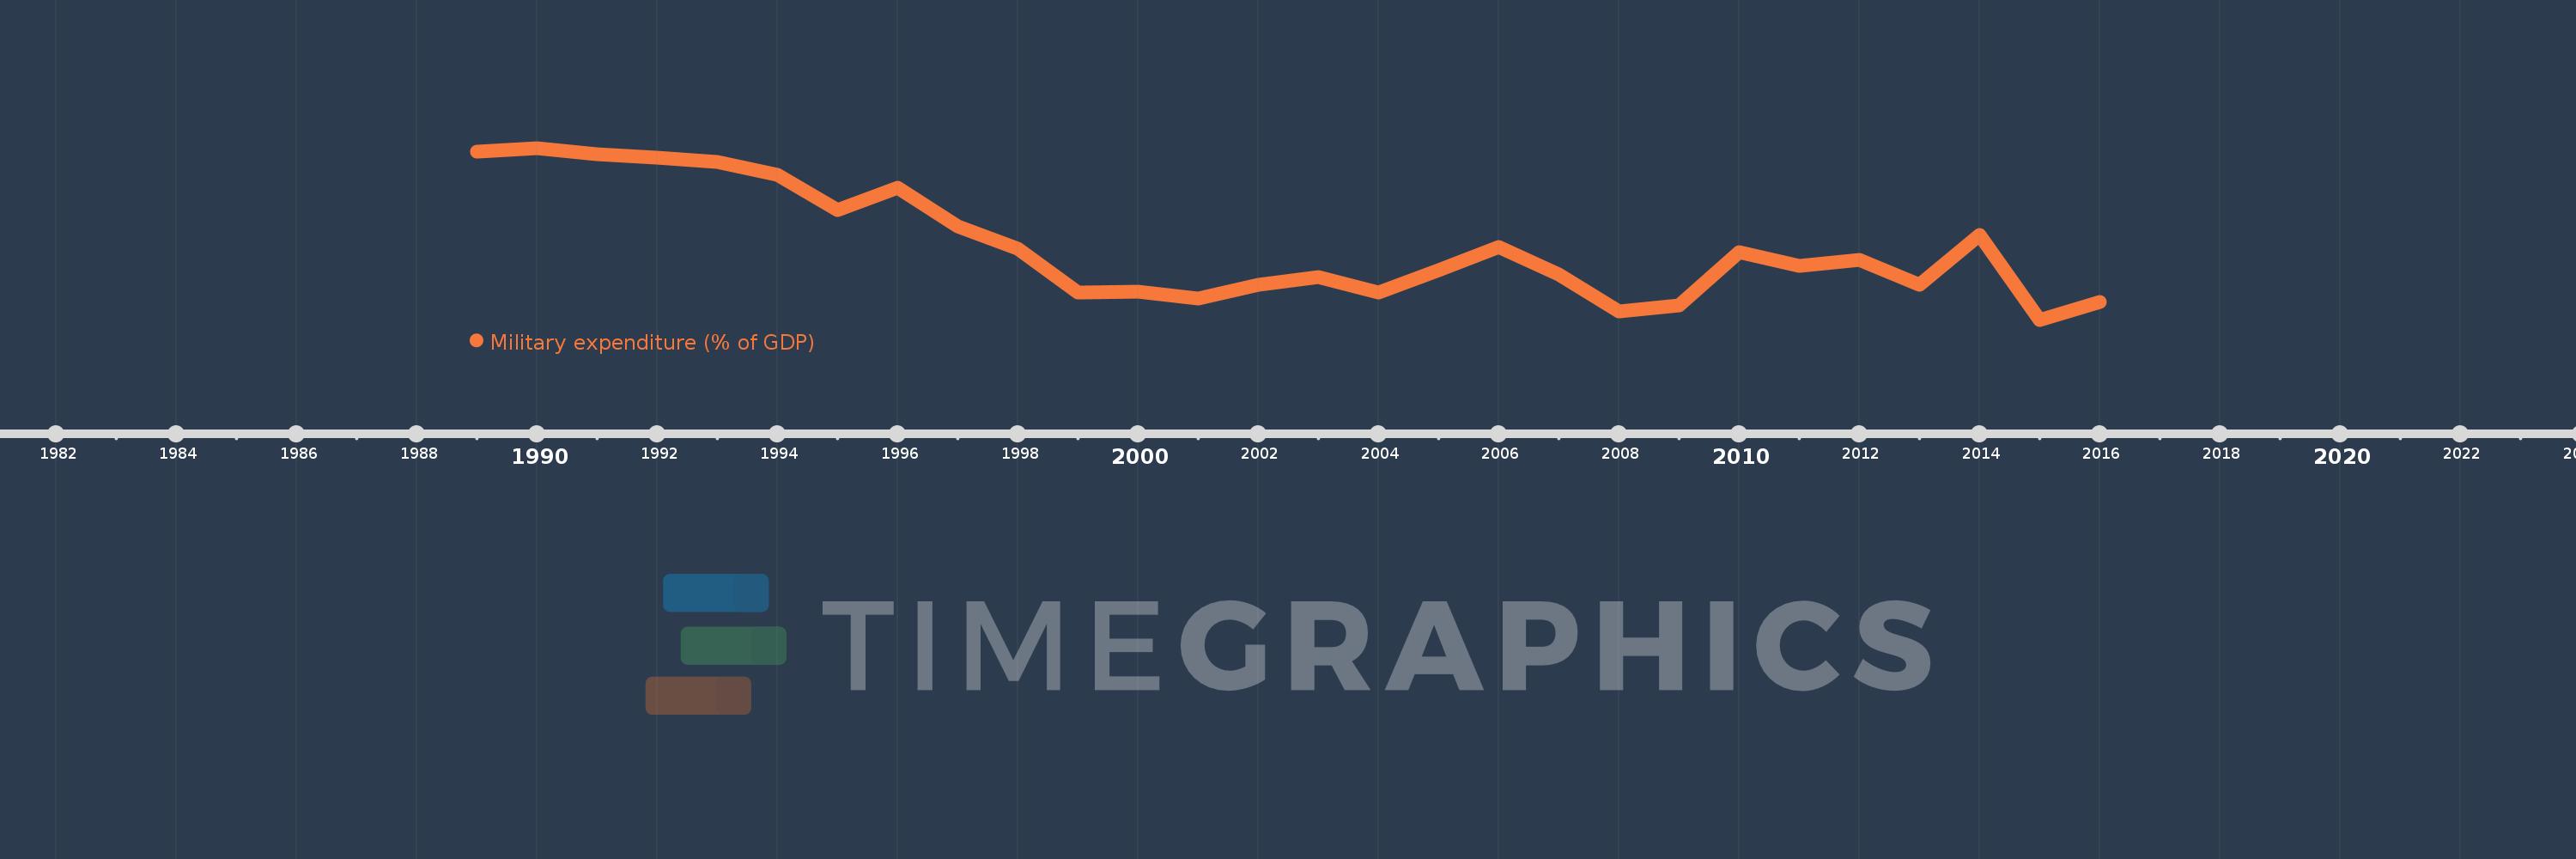
Military expenditure (% of GDP)
2016,2015,2014,2013,2012,2011,2010,2009,2008,2007,2006,2005,2004,2003,2002,2001,2000,1999,1998,1997,1996,1995,1994,1993,1992,1991,1990,1989
This statistics in other country:
Timeline:
This timeline shows a graph from 1989 to 2016 of Portugal. No data until 1988. Number of actual observations by date: 28.
Source name:
World Development Indicators
Source organization:
Stockholm International Peace Research Institute (SIPRI), Yearbook: Armaments, Disarmament and International Security.
Categories, topics:
Public Sector
Last updated:
apr 23, 2017
Indicators value changes by year
At the date of observation
Value
Absolute change
Change from previous value
jan 1, 1989
2.392
+2.392
0.0%
jan 1, 1990
2.404
+0.012
0.48%
jan 1, 1991
2.382
-0.022
-0.9%
jan 1, 1992
2.37
-0.011
-0.48%
jan 1, 1993
2.354
-0.017
-0.7%
jan 1, 1994
2.307
-0.047
-1.98%
jan 1, 1995
2.18
-0.127
-5.5%
jan 1, 1996
2.26
+0.08
3.68%
jan 1, 1997
2.121
-0.139
-6.17%
jan 1, 1998
2.041
-0.08
-3.78%
jan 1, 1999
1.884
-0.157
-7.69%
jan 1, 2000
1.888
+0.004
0.23%
jan 1, 2001
1.862
-0.026
-1.36%
jan 1, 2002
1.913
+0.05
2.7%
jan 1, 2003
1.939
+0.026
1.35%
jan 1, 2004
1.885
-0.053
-2.75%
jan 1, 2005
1.966
+0.081
4.28%
jan 1, 2006
2.047
+0.081
4.14%
jan 1, 2007
1.95
-0.097
-4.75%
jan 1, 2008
1.818
-0.132
-6.76%
jan 1, 2009
1.837
+0.019
1.02%
jan 1, 2010
2.031
+0.194
10.58%
jan 1, 2011
1.98
-0.051
-2.49%
jan 1, 2012
2.003
+0.022
1.13%
jan 1, 2013
1.912
-0.091
-4.52%
jan 1, 2014
2.09
+0.177
9.28%
jan 1, 2015
1.787
-0.303
-14.5%
jan 1, 2016
1.852
+0.065
3.65%
Ranking of countries by current statistics by years


Comments: