29
/
en
AIzaSyAYiBZKx7MnpbEhh9jyipgxe19OcubqV5w
April 1, 2024
39214
IDA only
IDX
false
2
1
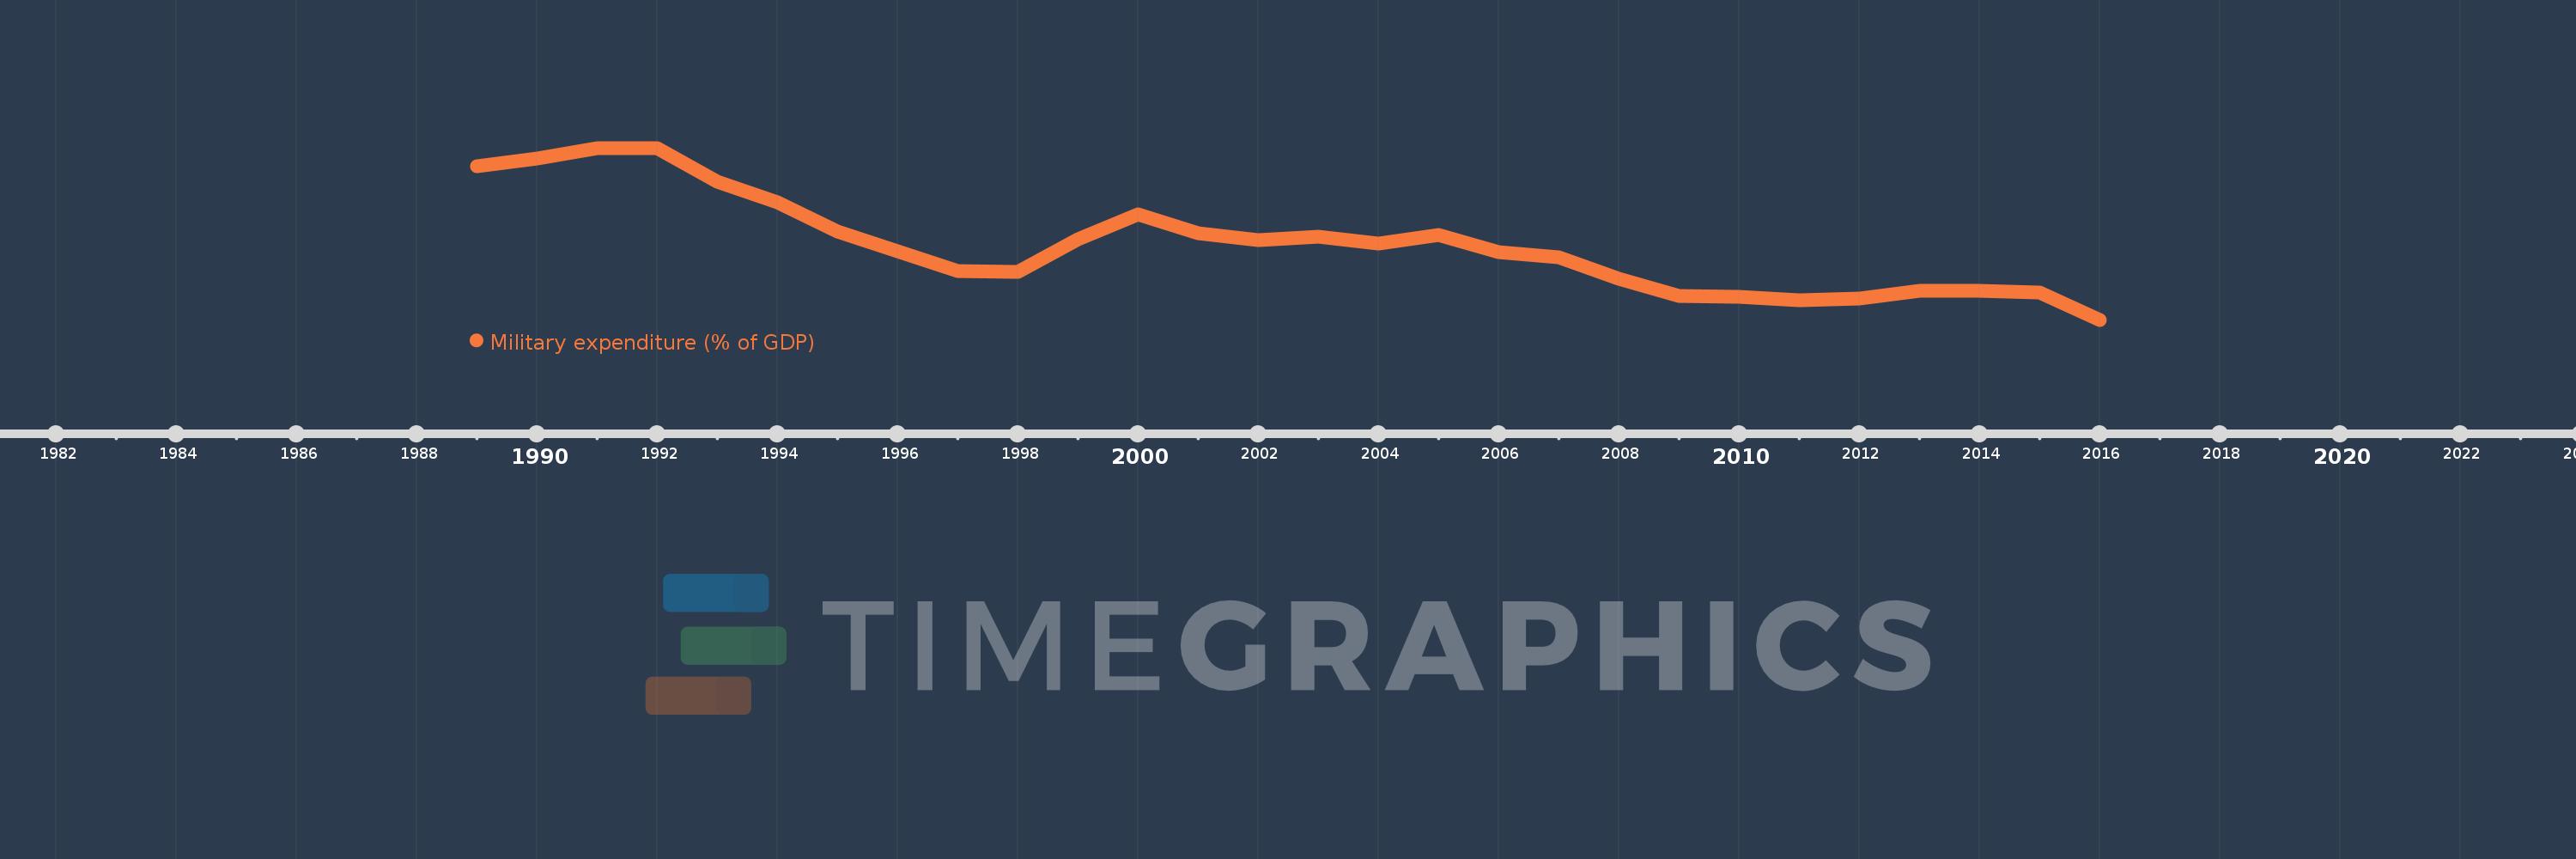
Military expenditure (% of GDP)
2016,2015,2014,2013,2012,2011,2010,2009,2008,2007,2006,2005,2004,2003,2002,2001,2000,1999,1998,1997,1996,1995,1994,1993,1992,1991,1990,1989
This statistics in other country:
Timeline:
This timeline shows a graph from 1989 to 2016 of IDA only. No data until 1988. Number of actual observations by date: 28.
Source name:
World Development Indicators
Source organization:
Stockholm International Peace Research Institute (SIPRI), Yearbook: Armaments, Disarmament and International Security.
Categories, topics:
Public Sector
Last updated:
apr 23, 2017
Indicators value changes by year
At the date of observation
Value
Absolute change
Change from previous value
jan 1, 1989
2.567
+2.567
0.0%
jan 1, 1990
2.636
+0.069
2.7%
jan 1, 1991
2.733
+0.097
3.69%
jan 1, 1992
2.733
+0.0
0.01%
jan 1, 1993
2.435
-0.298
-10.91%
jan 1, 1994
2.247
-0.188
-7.71%
jan 1, 1995
1.99
-0.257
-11.43%
jan 1, 1996
1.815
-0.175
-8.8%
jan 1, 1997
1.634
-0.181
-9.99%
jan 1, 1998
1.628
-0.006
-0.39%
jan 1, 1999
1.919
+0.291
17.87%
jan 1, 2000
2.14
+0.221
11.52%
jan 1, 2001
1.973
-0.166
-7.78%
jan 1, 2002
1.911
-0.062
-3.16%
jan 1, 2003
1.945
+0.034
1.79%
jan 1, 2004
1.885
-0.06
-3.09%
jan 1, 2005
1.96
+0.075
3.97%
jan 1, 2006
1.802
-0.158
-8.07%
jan 1, 2007
1.762
-0.04
-2.19%
jan 1, 2008
1.569
-0.193
-10.95%
jan 1, 2009
1.415
-0.155
-9.85%
jan 1, 2010
1.41
-0.005
-0.35%
jan 1, 2011
1.375
-0.035
-2.49%
jan 1, 2012
1.393
+0.018
1.33%
jan 1, 2013
1.464
+0.071
5.1%
jan 1, 2014
1.462
-0.002
-0.14%
jan 1, 2015
1.447
-0.016
-1.07%
jan 1, 2016
1.204
-0.242
-16.76%
Ranking of countries by current statistics by years


Comments: