29
/
en
AIzaSyAYiBZKx7MnpbEhh9jyipgxe19OcubqV5w
April 1, 2024
218654
Panama
PAN
true
2
1
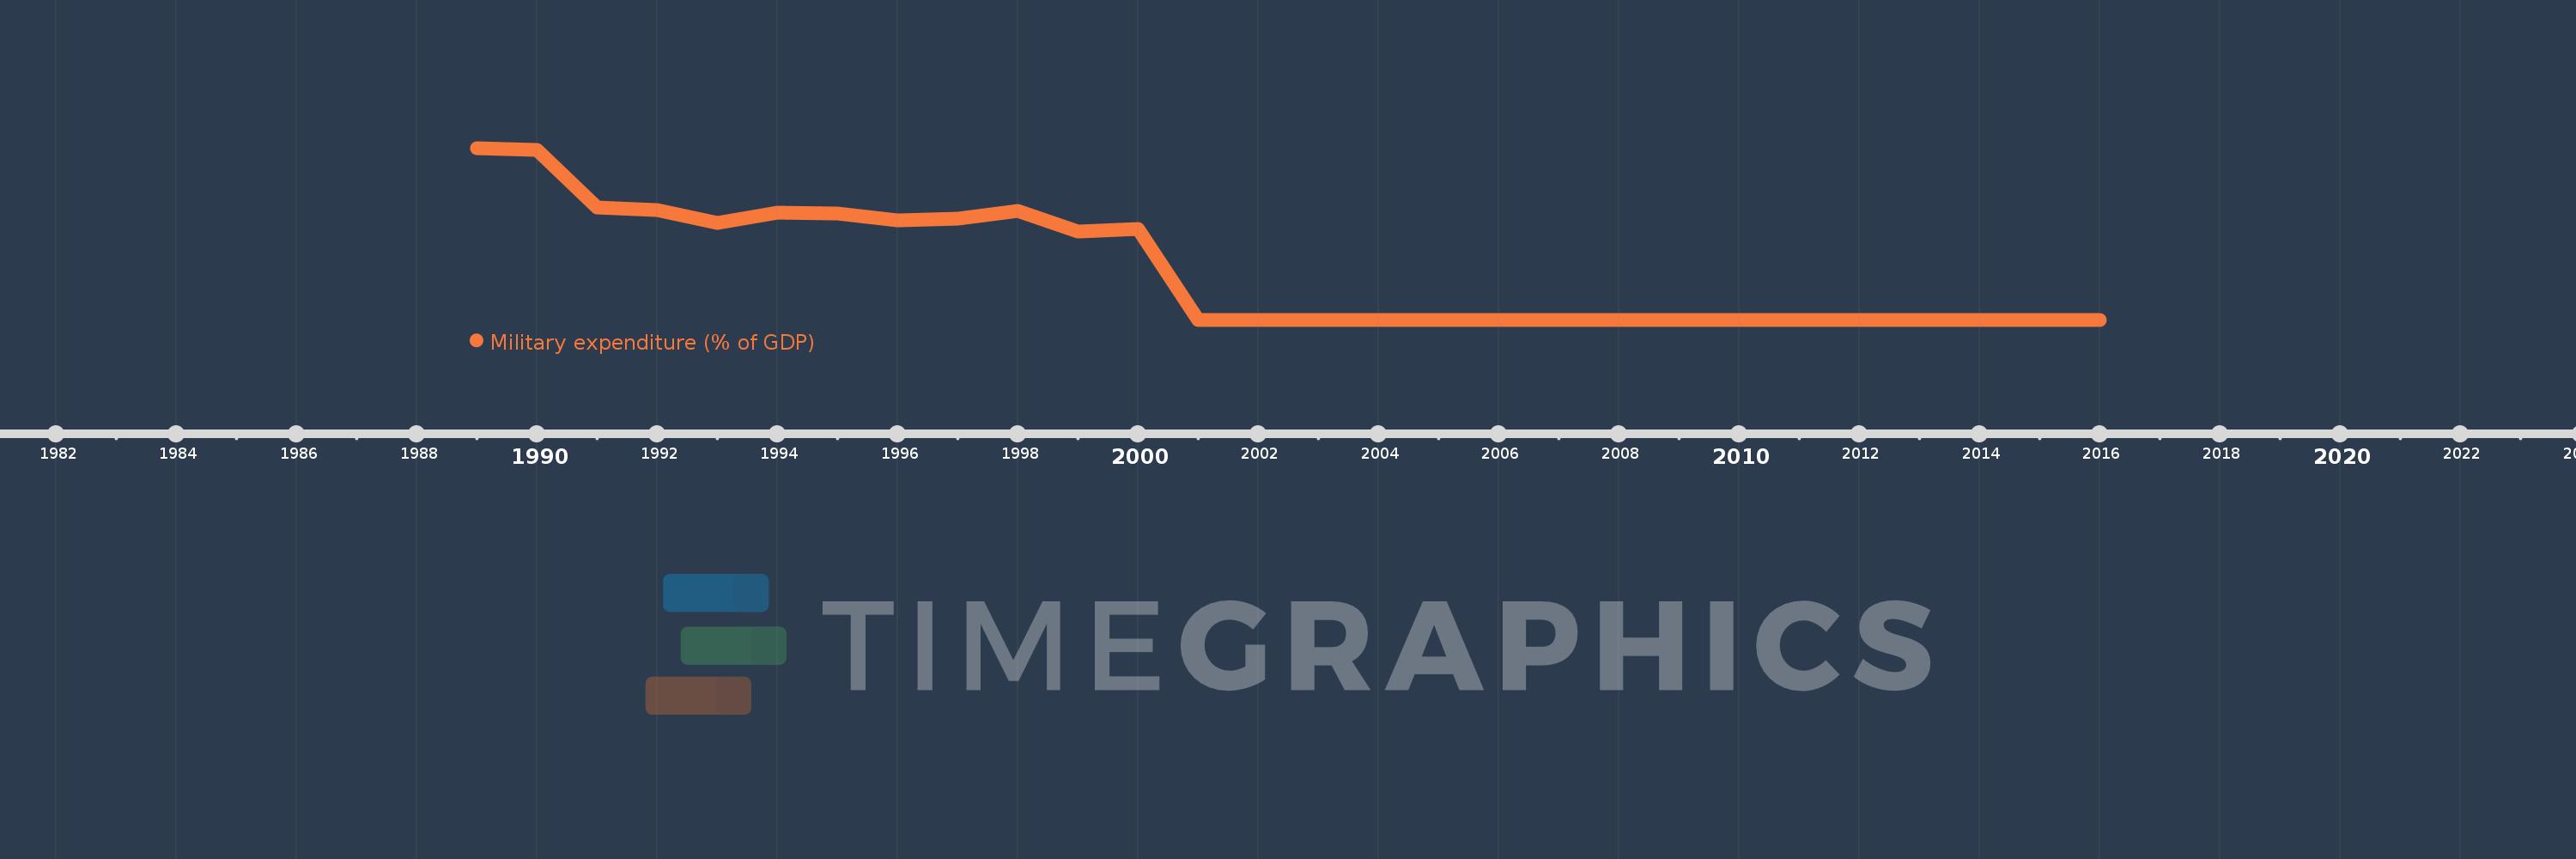
Military expenditure (% of GDP)
2016,2015,2014,2013,2012,2011,2010,2009,2008,2007,2006,2005,2004,2003,2002,2001,2000,1999,1998,1997,1996,1995,1994,1993,1992,1991,1990,1989
This statistics in other country:
Timeline:
This timeline shows a graph from 1989 to 2016 of Panama. No data until 1988. Number of actual observations by date: 28.
Source name:
World Development Indicators
Source organization:
Stockholm International Peace Research Institute (SIPRI), Yearbook: Armaments, Disarmament and International Security.
Categories, topics:
Public Sector
Last updated:
apr 23, 2017
Indicators value changes by year
At the date of observation
Value
Absolute change
Change from previous value
jan 1, 1989
1.743
+1.743
0.0%
jan 1, 1990
1.722
-0.022
-1.23%
jan 1, 1991
1.136
-0.586
-34.01%
jan 1, 1992
1.111
-0.025
-2.21%
jan 1, 1993
0.98
-0.131
-11.81%
jan 1, 1994
1.084
+0.104
10.63%
jan 1, 1995
1.078
-0.006
-0.51%
jan 1, 1996
1.009
-0.069
-6.44%
jan 1, 1997
1.025
+0.016
1.61%
jan 1, 1998
1.105
+0.08
7.79%
jan 1, 1999
0.898
-0.207
-18.7%
jan 1, 2000
0.92
+0.022
2.4%
jan 1, 2001
0.0
-0.92
-100.0%
Ranking of countries by current statistics by years


Comments: