29
/
en
AIzaSyAYiBZKx7MnpbEhh9jyipgxe19OcubqV5w
April 1, 2024
219857
Papua New Guinea
PNG
true
2
1
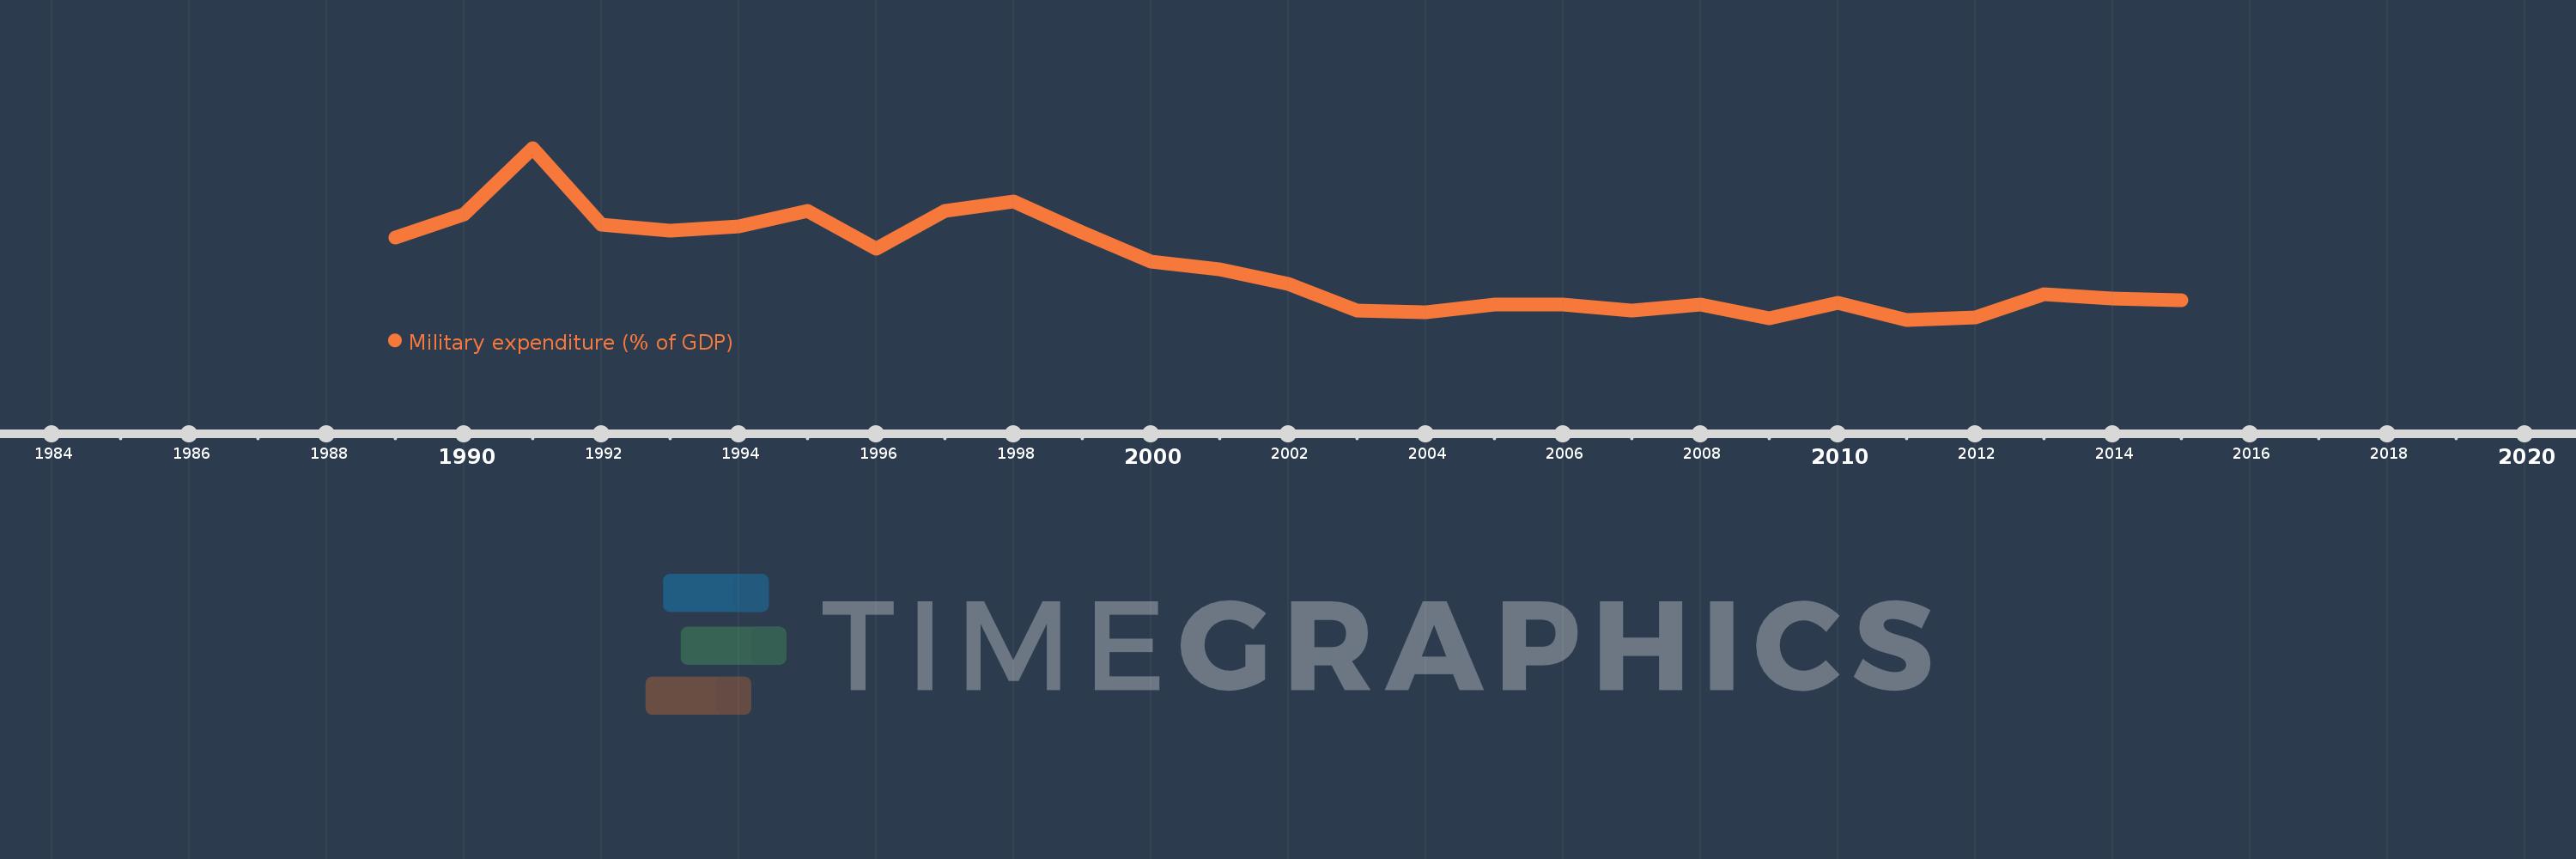
Military expenditure (% of GDP)
2015,2014,2013,2012,2011,2010,2009,2008,2007,2006,2005,2004,2003,2002,2001,2000,1999,1998,1997,1996,1995,1994,1993,1992,1991,1990,1989
This statistics in other country:
Timeline:
This timeline shows a graph from 1989 to 2015 of Papua New Guinea. No data until 1988. Number of actual observations by date: 27.
Source name:
World Development Indicators
Source organization:
Stockholm International Peace Research Institute (SIPRI), Yearbook: Armaments, Disarmament and International Security.
Categories, topics:
Public Sector
Last updated:
apr 23, 2017
Indicators value changes by year
At the date of observation
Value
Absolute change
Change from previous value
jan 1, 1989
1.266
+1.266
0.0%
jan 1, 1990
1.497
+0.23
18.19%
jan 1, 1991
2.133
+0.636
42.5%
jan 1, 1992
1.39
-0.743
-34.84%
jan 1, 1993
1.338
-0.052
-3.71%
jan 1, 1994
1.379
+0.041
3.04%
jan 1, 1995
1.523
+0.144
10.44%
jan 1, 1996
1.165
-0.357
-23.46%
jan 1, 1997
1.529
+0.363
31.18%
jan 1, 1998
1.616
+0.087
5.71%
jan 1, 1999
1.321
-0.295
-18.24%
jan 1, 2000
1.039
-0.282
-21.36%
jan 1, 2001
0.96
-0.079
-7.56%
jan 1, 2002
0.822
-0.138
-14.37%
jan 1, 2003
0.569
-0.254
-30.83%
jan 1, 2004
0.547
-0.021
-3.76%
jan 1, 2005
0.622
+0.075
13.62%
jan 1, 2006
0.626
+0.004
0.65%
jan 1, 2007
0.566
-0.06
-9.54%
jan 1, 2008
0.62
+0.053
9.4%
jan 1, 2009
0.492
-0.128
-20.65%
jan 1, 2010
0.642
+0.151
30.61%
jan 1, 2011
0.477
-0.165
-25.74%
jan 1, 2012
0.499
+0.022
4.56%
jan 1, 2013
0.719
+0.22
44.14%
jan 1, 2014
0.682
-0.037
-5.13%
jan 1, 2015
0.664
-0.018
-2.65%
Ranking of countries by current statistics by years


Comments: