29
/
en
AIzaSyAYiBZKx7MnpbEhh9jyipgxe19OcubqV5w
April 1, 2024
133416
Finland
FIN
true
2
1
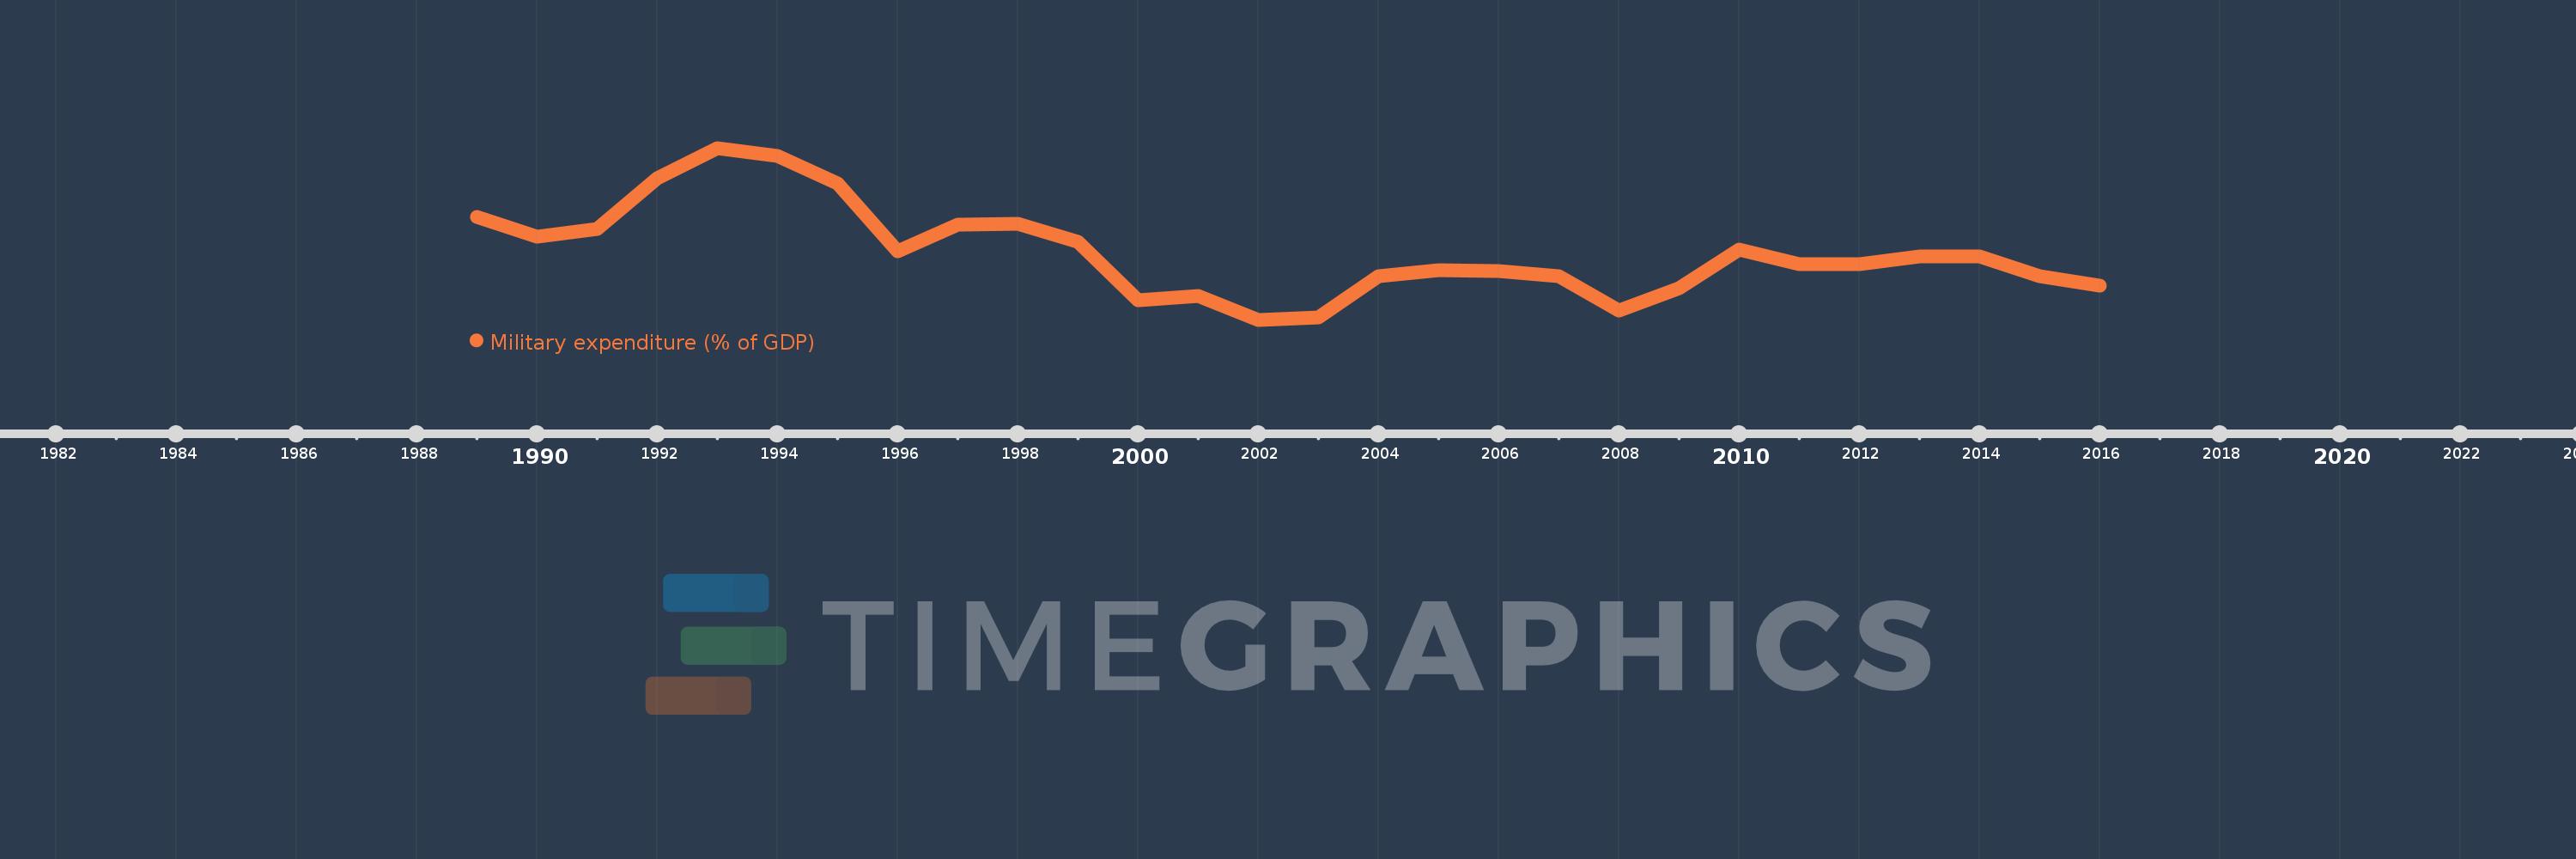
Military expenditure (% of GDP)
2016,2015,2014,2013,2012,2011,2010,2009,2008,2007,2006,2005,2004,2003,2002,2001,2000,1999,1998,1997,1996,1995,1994,1993,1992,1991,1990,1989
This statistics in other country:
Timeline:
This timeline shows a graph from 1989 to 2016 of Finland. No data until 1988. Number of actual observations by date: 28.
Source name:
World Development Indicators
Source organization:
Stockholm International Peace Research Institute (SIPRI), Yearbook: Armaments, Disarmament and International Security.
Categories, topics:
Public Sector
Last updated:
apr 23, 2017
Indicators value changes by year
At the date of observation
Value
Absolute change
Change from previous value
jan 1, 1989
1.562
+1.562
0.0%
jan 1, 1990
1.484
-0.078
-5.02%
jan 1, 1991
1.513
+0.029
1.97%
jan 1, 1992
1.721
+0.208
13.78%
jan 1, 1993
1.843
+0.122
7.07%
jan 1, 1994
1.81
-0.033
-1.8%
jan 1, 1995
1.7
-0.11
-6.08%
jan 1, 1996
1.423
-0.277
-16.32%
jan 1, 1997
1.53
+0.108
7.59%
jan 1, 1998
1.535
+0.005
0.31%
jan 1, 1999
1.463
-0.072
-4.69%
jan 1, 2000
1.223
-0.24
-16.41%
jan 1, 2001
1.241
+0.018
1.48%
jan 1, 2002
1.145
-0.097
-7.79%
jan 1, 2003
1.155
+0.01
0.88%
jan 1, 2004
1.323
+0.169
14.61%
jan 1, 2005
1.345
+0.021
1.61%
jan 1, 2006
1.342
-0.003
-0.2%
jan 1, 2007
1.321
-0.021
-1.53%
jan 1, 2008
1.181
-0.141
-10.65%
jan 1, 2009
1.274
+0.093
7.91%
jan 1, 2010
1.431
+0.157
12.34%
jan 1, 2011
1.372
-0.059
-4.14%
jan 1, 2012
1.37
-0.002
-0.15%
jan 1, 2013
1.403
+0.034
2.45%
jan 1, 2014
1.403
-0.001
-0.06%
jan 1, 2015
1.321
-0.082
-5.81%
jan 1, 2016
1.284
-0.037
-2.79%
Ranking of countries by current statistics by years


Comments: