29
/
en
AIzaSyAYiBZKx7MnpbEhh9jyipgxe19OcubqV5w
April 1, 2024
176690
Lebanon
LBN
true
2
1
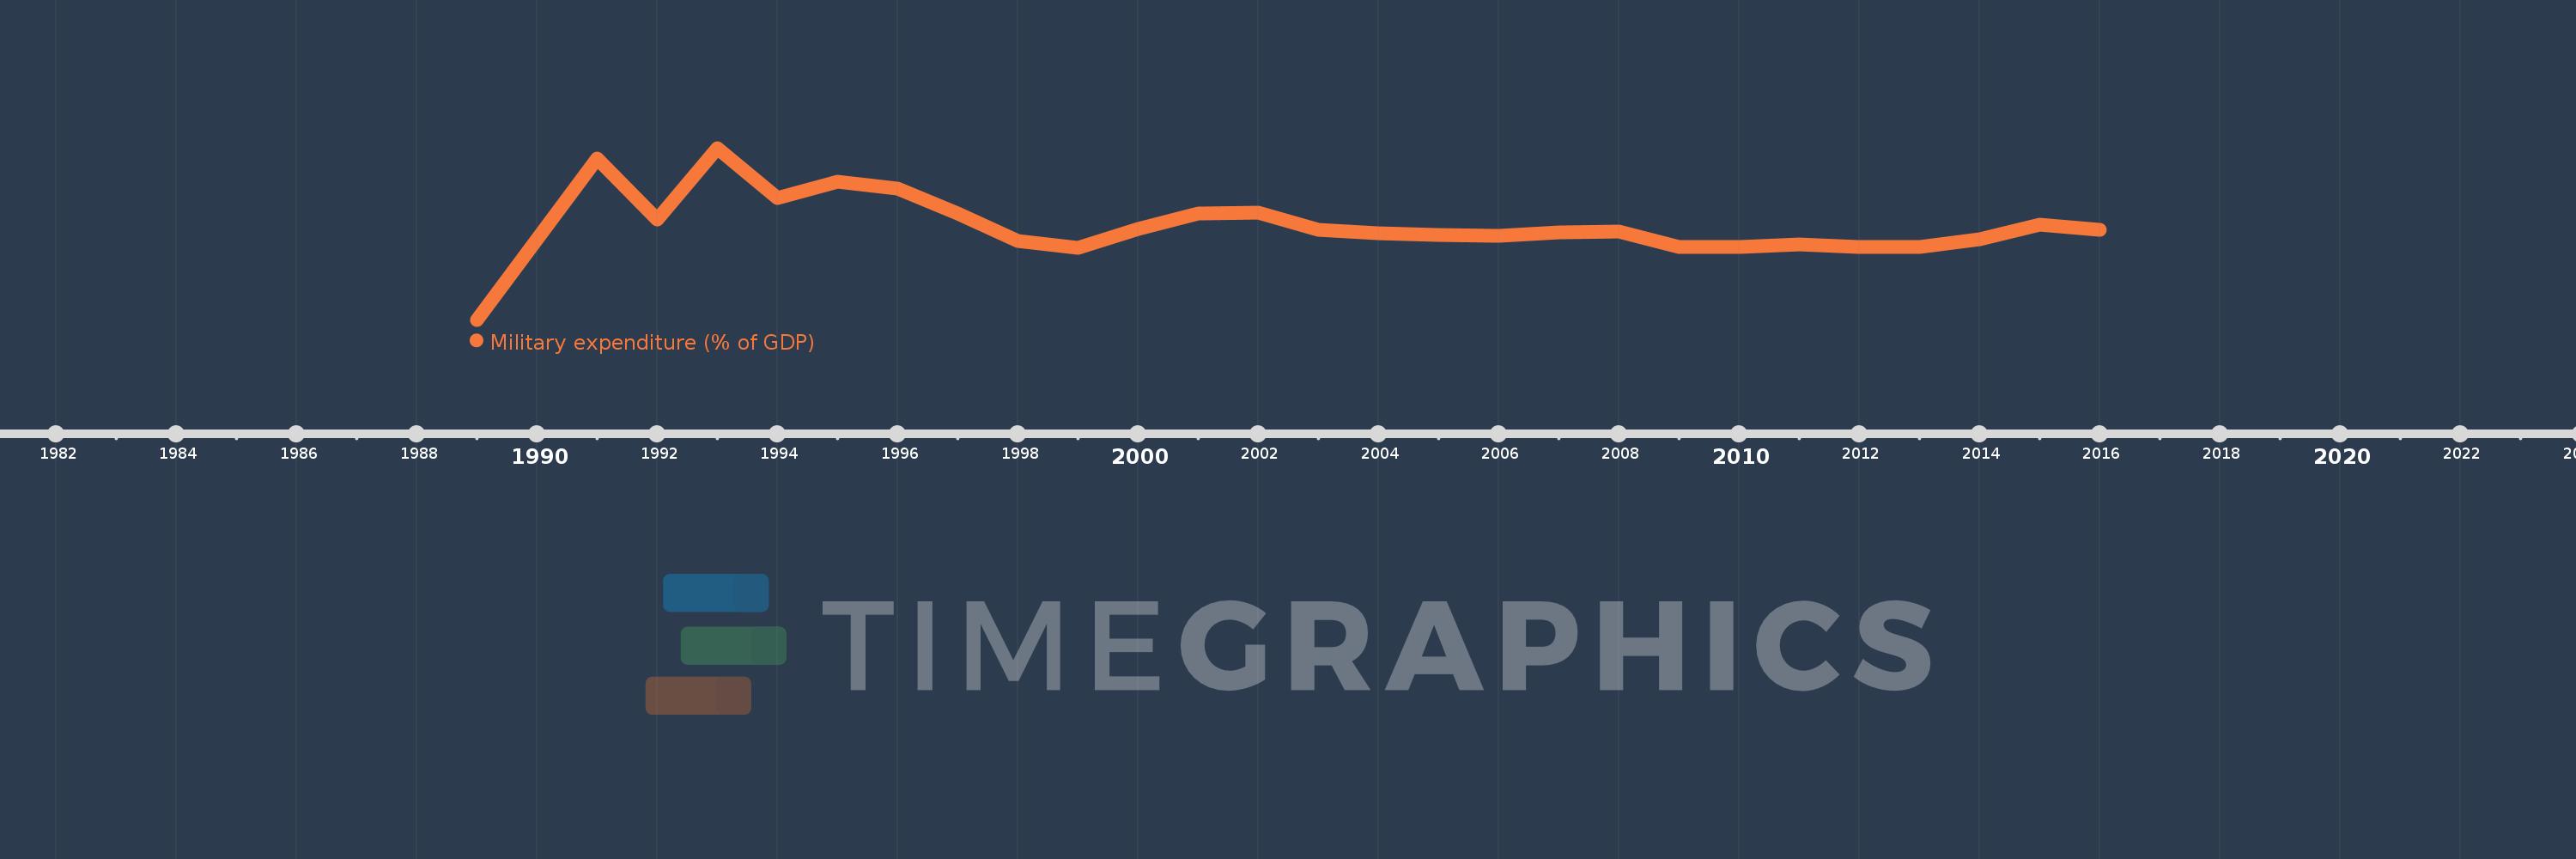
Military expenditure (% of GDP)
2016,2015,2014,2013,2012,2011,2010,2009,2008,2007,2006,2005,2004,2003,2002,2001,2000,1999,1998,1997,1996,1995,1994,1993,1992,1991,1989
This statistics in other country:
Timeline:
This timeline shows a graph from 1989 to 2016 of Lebanon. No data until 1988. Number of actual observations by date: 27.
Source name:
World Development Indicators
Source organization:
Stockholm International Peace Research Institute (SIPRI), Yearbook: Armaments, Disarmament and International Security.
Categories, topics:
Public Sector
Last updated:
apr 23, 2017
Indicators value changes by year
At the date of observation
Value
Absolute change
Change from previous value
jan 1, 1989
1.187
+1.187
0.0%
jan 1, 1991
7.552
+6.365
536.45%
jan 1, 1992
5.155
-2.397
-31.74%
jan 1, 1993
7.984
+2.829
54.88%
jan 1, 1994
6.011
-1.973
-24.71%
jan 1, 1995
6.641
+0.629
10.47%
jan 1, 1996
6.368
-0.273
-4.11%
jan 1, 1997
5.374
-0.995
-15.62%
jan 1, 1998
4.305
-1.068
-19.88%
jan 1, 1999
4.023
-0.282
-6.55%
jan 1, 2000
4.771
+0.748
18.58%
jan 1, 2001
5.388
+0.618
12.94%
jan 1, 2002
5.431
+0.043
0.79%
jan 1, 2003
4.738
-0.693
-12.76%
jan 1, 2004
4.598
-0.14
-2.96%
jan 1, 2005
4.555
-0.043
-0.93%
jan 1, 2006
4.522
-0.034
-0.74%
jan 1, 2007
4.629
+0.107
2.38%
jan 1, 2008
4.688
+0.059
1.28%
jan 1, 2009
4.057
-0.632
-13.48%
jan 1, 2010
4.059
+0.002
0.05%
jan 1, 2011
4.171
+0.112
2.77%
jan 1, 2012
4.058
-0.113
-2.7%
jan 1, 2013
4.067
+0.009
0.22%
jan 1, 2014
4.364
+0.297
7.31%
jan 1, 2015
4.964
+0.6
13.74%
jan 1, 2016
4.756
-0.208
-4.19%
Ranking of countries by current statistics by years


Comments: