29
/
en
AIzaSyAYiBZKx7MnpbEhh9jyipgxe19OcubqV5w
April 1, 2024
109955
Congo, Dem. Rep.
COD
true
2
1
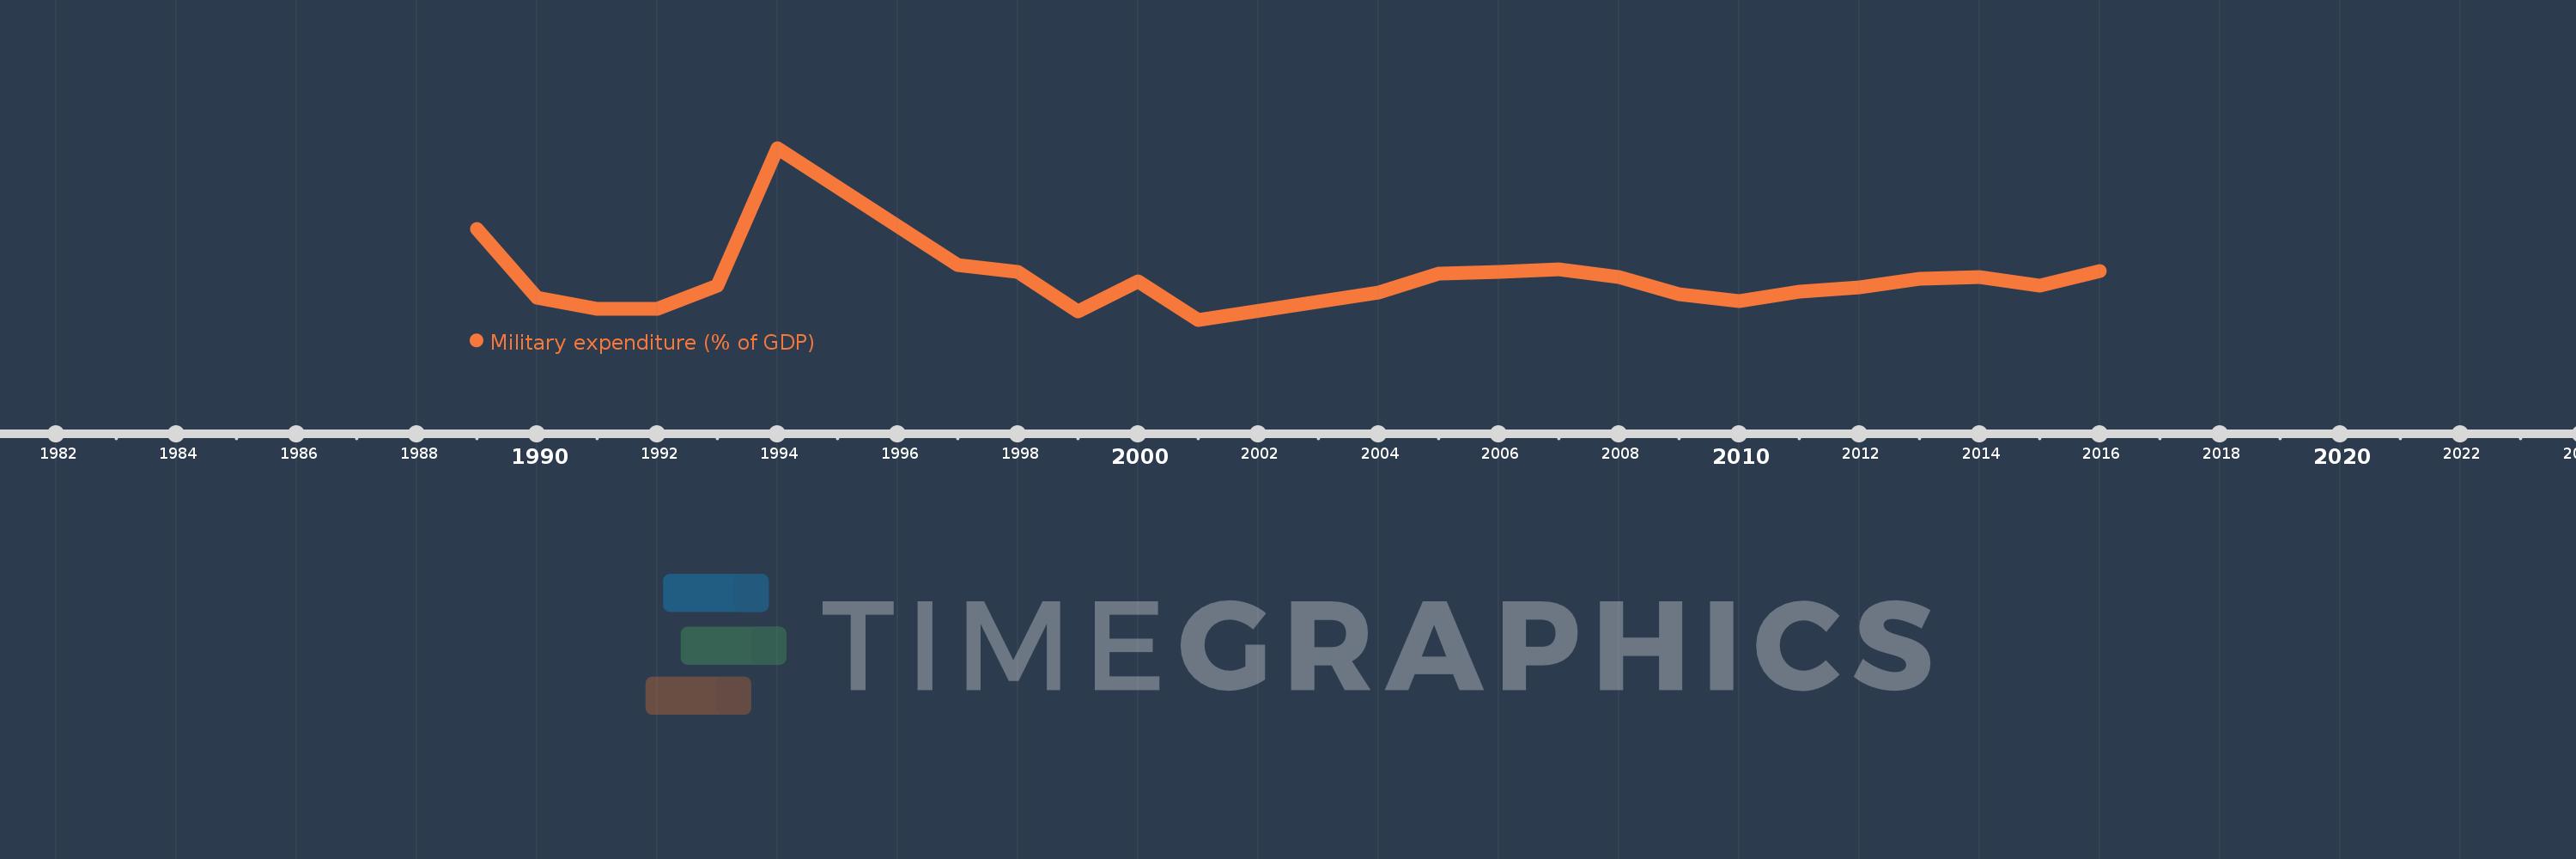
Military expenditure (% of GDP)
2016,2015,2014,2013,2012,2011,2010,2009,2008,2007,2006,2005,2004,2001,2000,1999,1998,1997,1994,1993,1992,1991,1990,1989
This statistics in other country:
Timeline:
This timeline shows a graph from 1989 to 2016 of Congo, Dem. Rep.. No data until 1988. Number of actual observations by date: 24.
Source name:
World Development Indicators
Source organization:
Stockholm International Peace Research Institute (SIPRI), Yearbook: Armaments, Disarmament and International Security.
Categories, topics:
Public Sector
Last updated:
apr 23, 2017
Indicators value changes by year
At the date of observation
Value
Absolute change
Change from previous value
jan 1, 1989
2.426
+2.426
0.0%
jan 1, 1990
0.748
-1.677
-69.16%
jan 1, 1991
0.491
-0.257
-34.33%
jan 1, 1992
0.483
-0.008
-1.69%
jan 1, 1993
1.042
+0.559
115.8%
jan 1, 1994
4.382
+3.339
320.41%
jan 1, 1997
1.547
-2.835
-64.7%
jan 1, 1998
1.376
-0.17
-11.02%
jan 1, 1999
0.428
-0.948
-68.87%
jan 1, 2000
1.158
+0.73
170.32%
jan 1, 2001
0.22
-0.938
-80.98%
jan 1, 2004
0.881
+0.66
299.82%
jan 1, 2005
1.337
+0.456
51.78%
jan 1, 2006
1.381
+0.044
3.31%
jan 1, 2007
1.435
+0.054
3.9%
jan 1, 2008
1.254
-0.181
-12.59%
jan 1, 2009
0.833
-0.421
-33.57%
jan 1, 2010
0.67
-0.163
-19.56%
jan 1, 2011
0.895
+0.225
33.56%
jan 1, 2012
1.001
+0.106
11.87%
jan 1, 2013
1.211
+0.209
20.92%
jan 1, 2014
1.248
+0.037
3.05%
jan 1, 2015
1.041
-0.207
-16.55%
jan 1, 2016
1.394
+0.353
33.91%
Ranking of countries by current statistics by years


Comments: