29
/
en
AIzaSyAYiBZKx7MnpbEhh9jyipgxe19OcubqV5w
April 1, 2024
30911
Europe & Central Asia
ECS
false
2
1
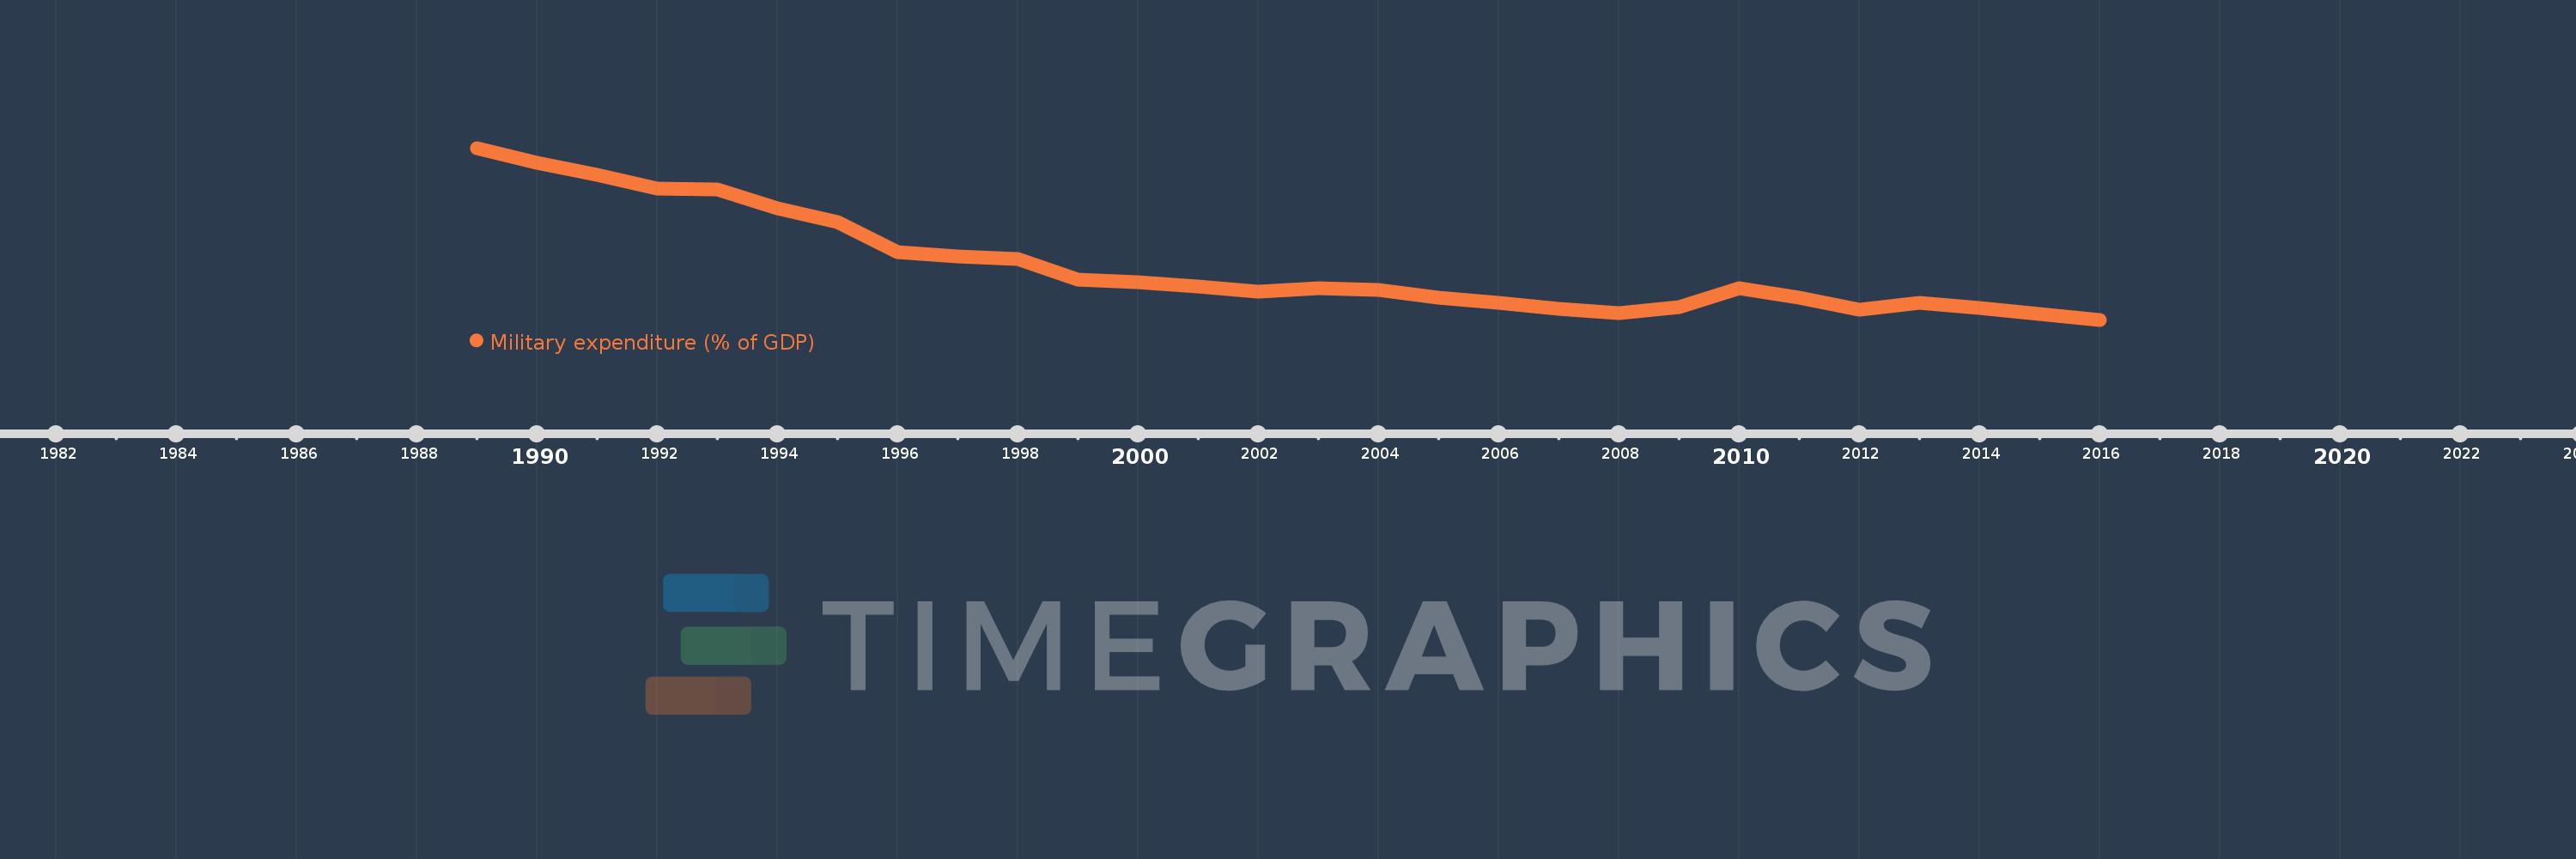
Military expenditure (% of GDP)
2016,2015,2014,2013,2012,2011,2010,2009,2008,2007,2006,2005,2004,2003,2002,2001,2000,1999,1998,1997,1996,1995,1994,1993,1992,1991,1990,1989
This statistics in other country:
Timeline:
This timeline shows a graph from 1989 to 2016 of Europe & Central Asia. No data until 1988. Number of actual observations by date: 28.
Source name:
World Development Indicators
Source organization:
Stockholm International Peace Research Institute (SIPRI), Yearbook: Armaments, Disarmament and International Security.
Categories, topics:
Public Sector
Last updated:
apr 23, 2017
Indicators value changes by year
At the date of observation
Value
Absolute change
Change from previous value
jan 1, 1989
2.757
+2.757
0.0%
jan 1, 1990
2.67
-0.087
-3.16%
jan 1, 1991
2.598
-0.072
-2.68%
jan 1, 1992
2.516
-0.082
-3.17%
jan 1, 1993
2.51
-0.006
-0.23%
jan 1, 1994
2.399
-0.111
-4.41%
jan 1, 1995
2.315
-0.085
-3.53%
jan 1, 1996
2.134
-0.181
-7.82%
jan 1, 1997
2.109
-0.025
-1.17%
jan 1, 1998
2.096
-0.013
-0.62%
jan 1, 1999
1.972
-0.124
-5.92%
jan 1, 2000
1.96
-0.012
-0.59%
jan 1, 2001
1.934
-0.026
-1.32%
jan 1, 2002
1.902
-0.032
-1.65%
jan 1, 2003
1.924
+0.022
1.15%
jan 1, 2004
1.91
-0.014
-0.71%
jan 1, 2005
1.867
-0.043
-2.27%
jan 1, 2006
1.836
-0.031
-1.64%
jan 1, 2007
1.8
-0.036
-1.98%
jan 1, 2008
1.775
-0.025
-1.41%
jan 1, 2009
1.808
+0.033
1.89%
jan 1, 2010
1.922
+0.114
6.31%
jan 1, 2011
1.864
-0.058
-3.01%
jan 1, 2012
1.796
-0.069
-3.68%
jan 1, 2013
1.837
+0.041
2.26%
jan 1, 2014
1.806
-0.031
-1.68%
jan 1, 2015
1.769
-0.037
-2.06%
jan 1, 2016
1.734
-0.035
-1.95%
Ranking of countries by current statistics by years


Comments: