29
/
en
AIzaSyAYiBZKx7MnpbEhh9jyipgxe19OcubqV5w
April 1, 2024
66304
Algeria
DZA
true
2
1
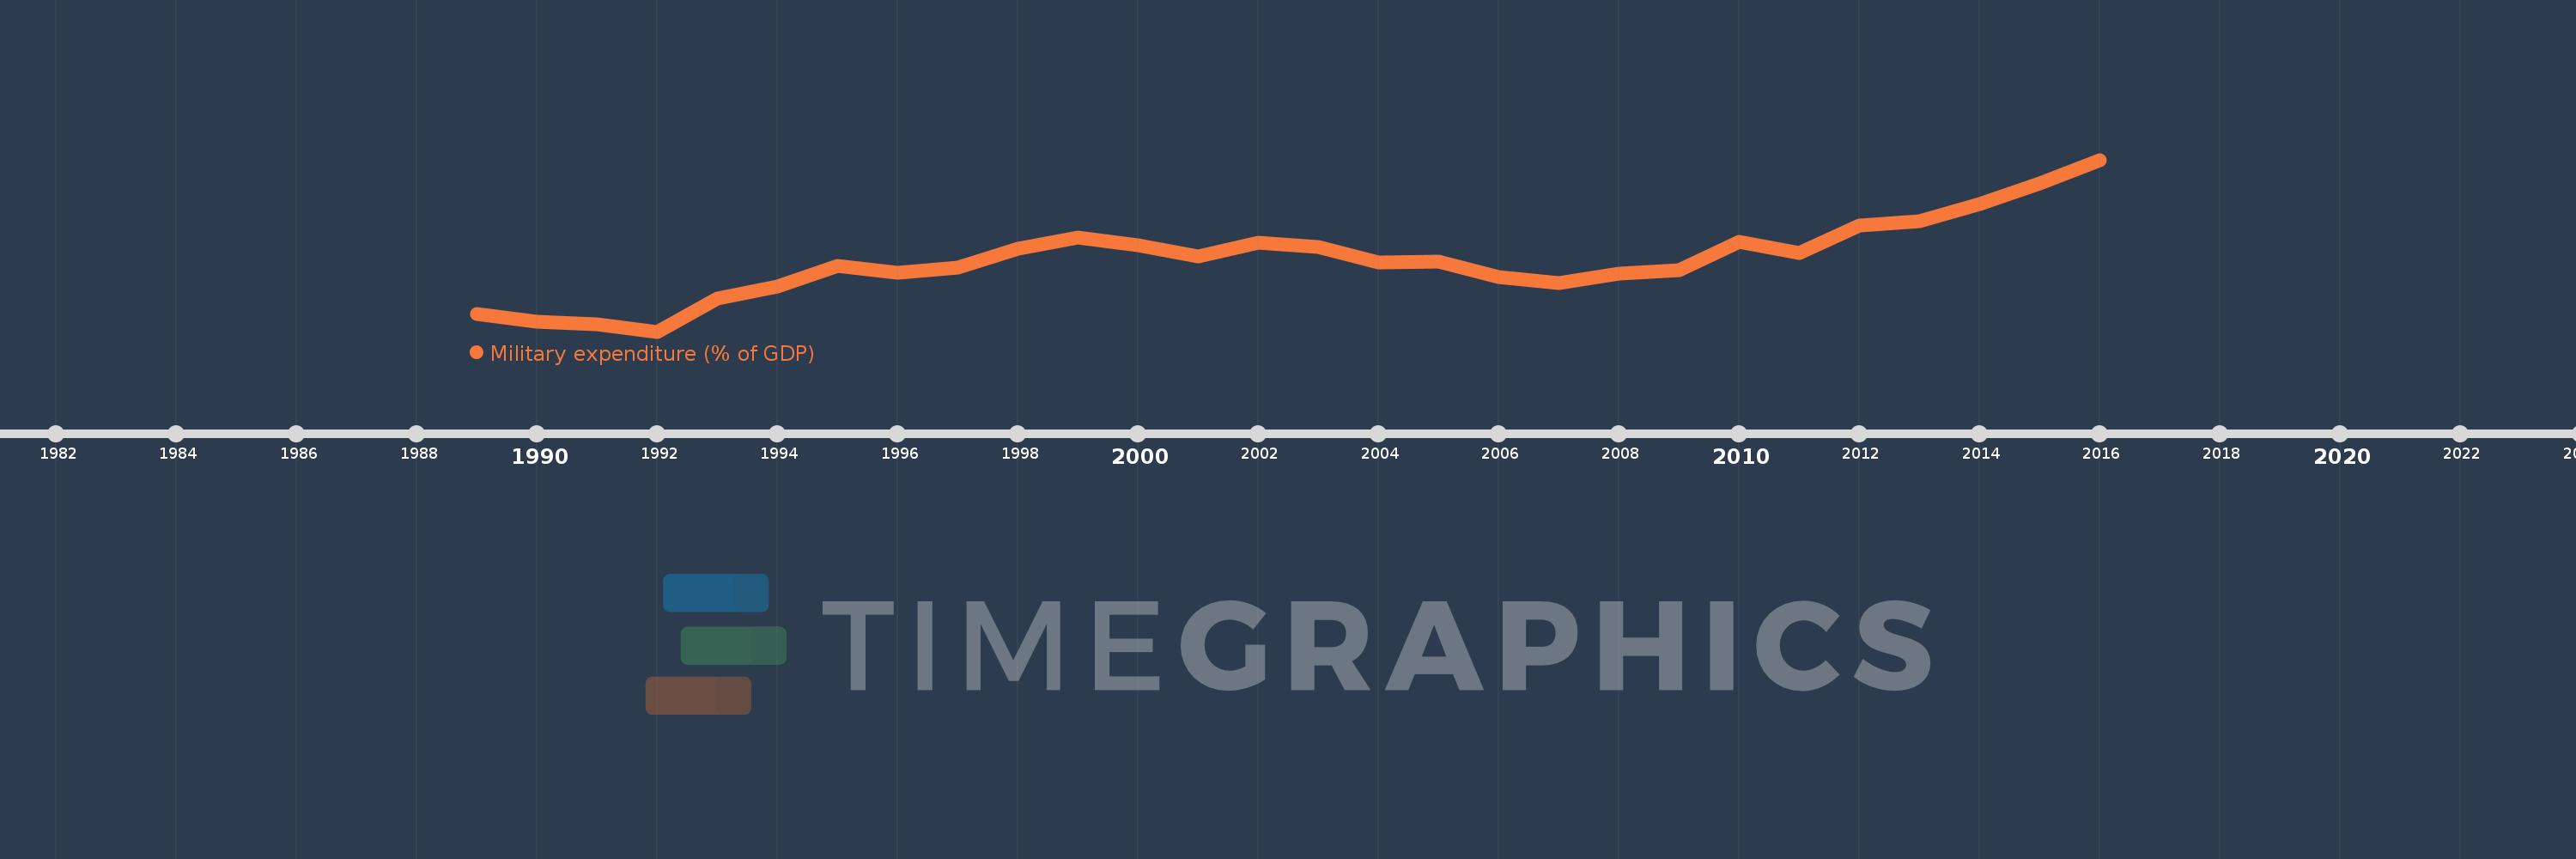
Military expenditure (% of GDP)
2016,2015,2014,2013,2012,2011,2010,2009,2008,2007,2006,2005,2004,2003,2002,2001,2000,1999,1998,1997,1996,1995,1994,1993,1992,1991,1990,1989
This statistics in other country:
Timeline:
This timeline shows a graph from 1989 to 2016 of Algeria. No data until 1988. Number of actual observations by date: 28.
Source name:
World Development Indicators
Source organization:
Stockholm International Peace Research Institute (SIPRI), Yearbook: Armaments, Disarmament and International Security.
Categories, topics:
Public Sector
Last updated:
apr 23, 2017
Indicators value changes by year
At the date of observation
Value
Absolute change
Change from previous value
jan 1, 1989
1.741
+1.741
0.0%
jan 1, 1990
1.536
-0.205
-11.79%
jan 1, 1991
1.457
-0.078
-5.09%
jan 1, 1992
1.236
-0.221
-15.18%
jan 1, 1993
2.194
+0.958
77.51%
jan 1, 1994
2.557
+0.362
16.51%
jan 1, 1995
3.138
+0.581
22.73%
jan 1, 1996
2.956
-0.182
-5.79%
jan 1, 1997
3.094
+0.138
4.66%
jan 1, 1998
3.637
+0.543
17.56%
jan 1, 1999
3.966
+0.328
9.03%
jan 1, 2000
3.755
-0.211
-5.31%
jan 1, 2001
3.433
-0.322
-8.57%
jan 1, 2002
3.821
+0.387
11.28%
jan 1, 2003
3.701
-0.12
-3.14%
jan 1, 2004
3.251
-0.45
-12.15%
jan 1, 2005
3.284
+0.033
1.01%
jan 1, 2006
2.834
-0.45
-13.69%
jan 1, 2007
2.644
-0.19
-6.72%
jan 1, 2008
2.923
+0.28
10.57%
jan 1, 2009
3.025
+0.101
3.47%
jan 1, 2010
3.849
+0.824
27.23%
jan 1, 2011
3.518
-0.33
-8.59%
jan 1, 2012
4.326
+0.808
22.96%
jan 1, 2013
4.461
+0.135
3.13%
jan 1, 2014
4.962
+0.501
11.22%
jan 1, 2015
5.556
+0.594
11.97%
jan 1, 2016
6.238
+0.682
12.27%
Ranking of countries by current statistics by years


Comments: