29
/
en
AIzaSyAYiBZKx7MnpbEhh9jyipgxe19OcubqV5w
April 1, 2024
29298
East Asia & Pacific (IDA & IBRD countries)
TEA
false
2
1
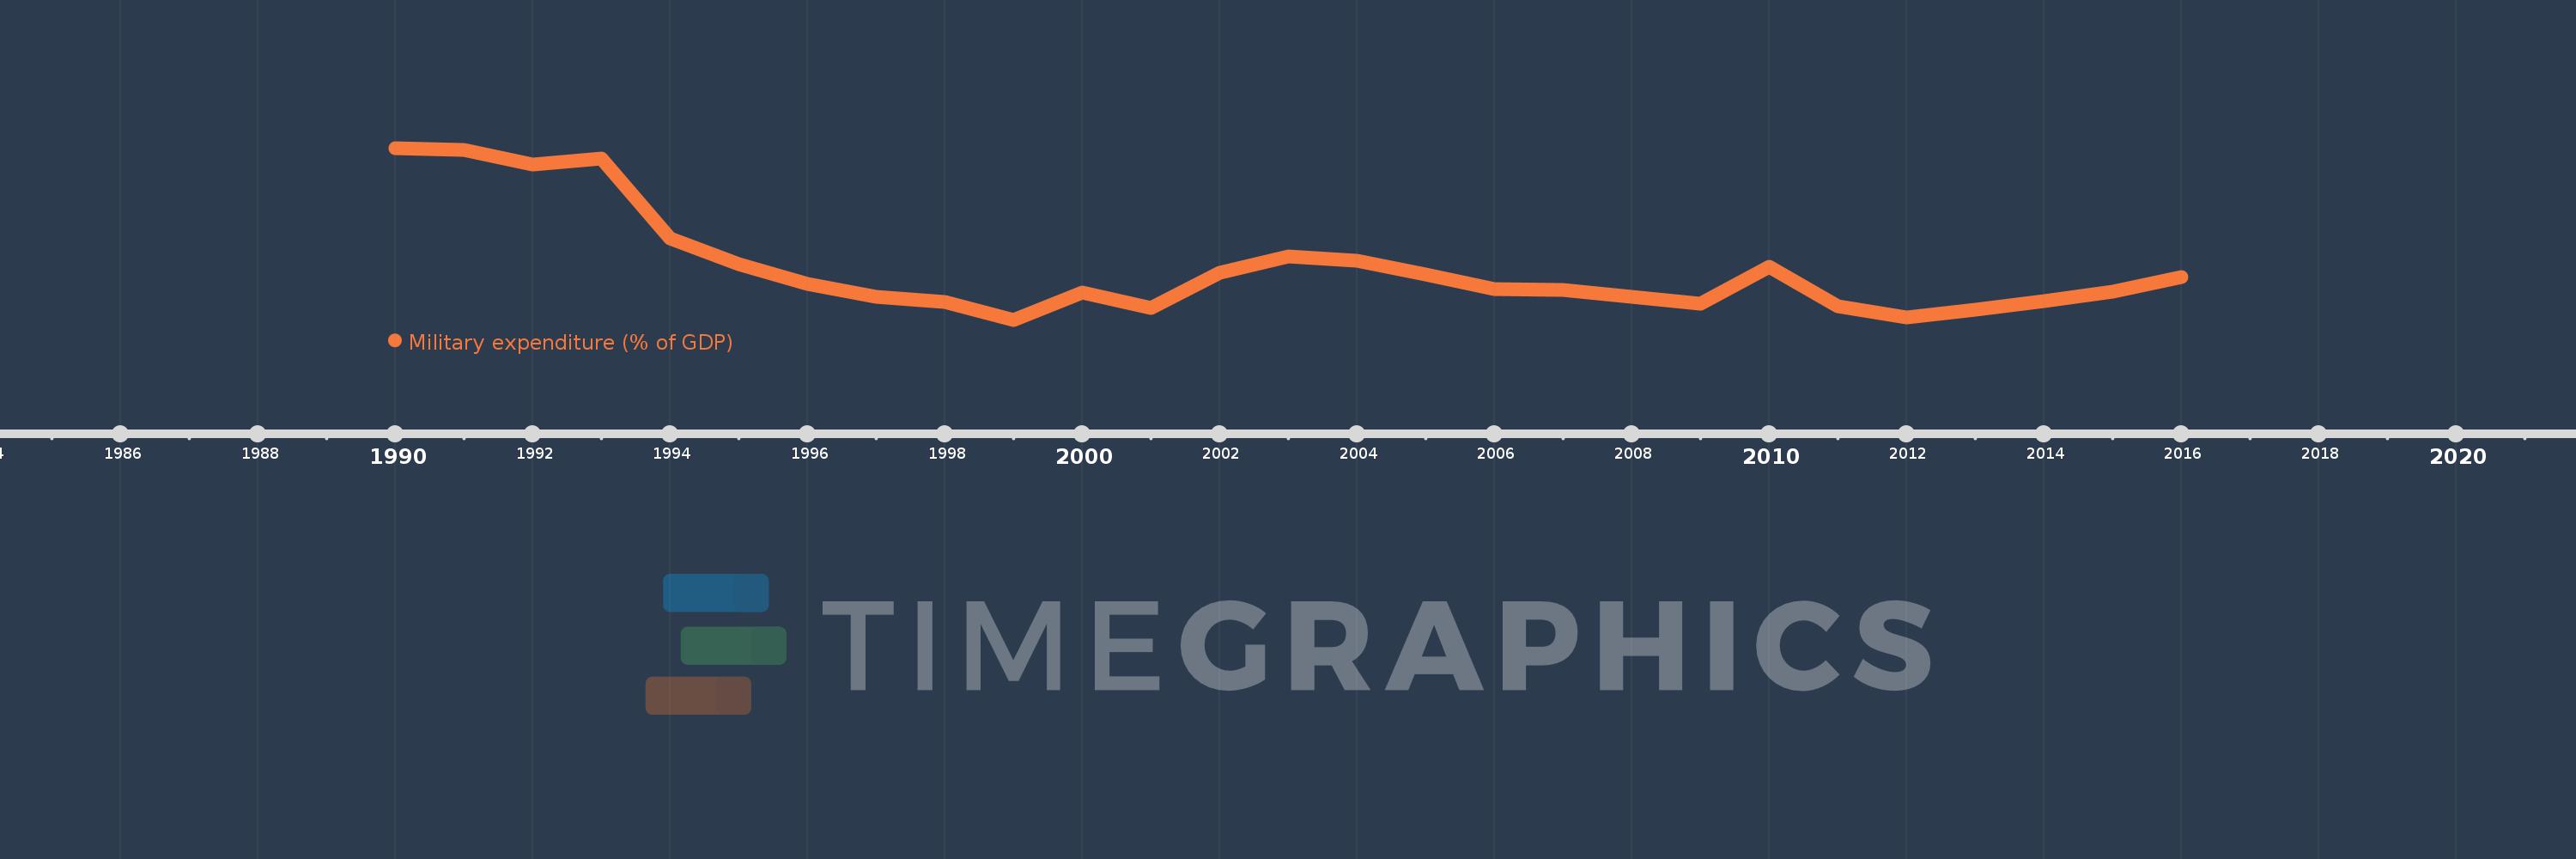
Military expenditure (% of GDP)
2016,2015,2014,2013,2012,2011,2010,2009,2008,2007,2006,2005,2004,2003,2002,2001,2000,1999,1998,1997,1996,1995,1994,1993,1992,1991,1990
This statistics in other country:
Timeline:
This timeline shows a graph from 1990 to 2016 of East Asia & Pacific (IDA & IBRD countries). No data until 1989. Number of actual observations by date: 27.
Source name:
World Development Indicators
Source organization:
Stockholm International Peace Research Institute (SIPRI), Yearbook: Armaments, Disarmament and International Security.
Categories, topics:
Public Sector
Last updated:
apr 23, 2017
Indicators value changes by year
At the date of observation
Value
Absolute change
Change from previous value
jan 1, 1990
2.431
+2.431
0.0%
jan 1, 1991
2.424
-0.007
-0.28%
jan 1, 1992
2.356
-0.067
-2.78%
jan 1, 1993
2.385
+0.028
1.2%
jan 1, 1994
2.027
-0.357
-14.99%
jan 1, 1995
1.914
-0.113
-5.57%
jan 1, 1996
1.826
-0.088
-4.6%
jan 1, 1997
1.767
-0.06
-3.26%
jan 1, 1998
1.744
-0.023
-1.29%
jan 1, 1999
1.665
-0.079
-4.51%
jan 1, 2000
1.786
+0.121
7.27%
jan 1, 2001
1.718
-0.069
-3.85%
jan 1, 2002
1.873
+0.156
9.07%
jan 1, 2003
1.948
+0.075
3.99%
jan 1, 2004
1.929
-0.019
-0.97%
jan 1, 2005
1.868
-0.061
-3.18%
jan 1, 2006
1.8
-0.068
-3.61%
jan 1, 2007
1.799
-0.002
-0.09%
jan 1, 2008
1.768
-0.03
-1.69%
jan 1, 2009
1.738
-0.03
-1.69%
jan 1, 2010
1.903
+0.165
9.47%
jan 1, 2011
1.725
-0.178
-9.35%
jan 1, 2012
1.675
-0.05
-2.89%
jan 1, 2013
1.708
+0.033
2.0%
jan 1, 2014
1.75
+0.042
2.46%
jan 1, 2015
1.791
+0.04
2.31%
jan 1, 2016
1.855
+0.064
3.58%
Ranking of countries by current statistics by years


Comments: