29
/
en
AIzaSyAYiBZKx7MnpbEhh9jyipgxe19OcubqV5w
April 1, 2024
123804
Ecuador
ECU
true
2
1
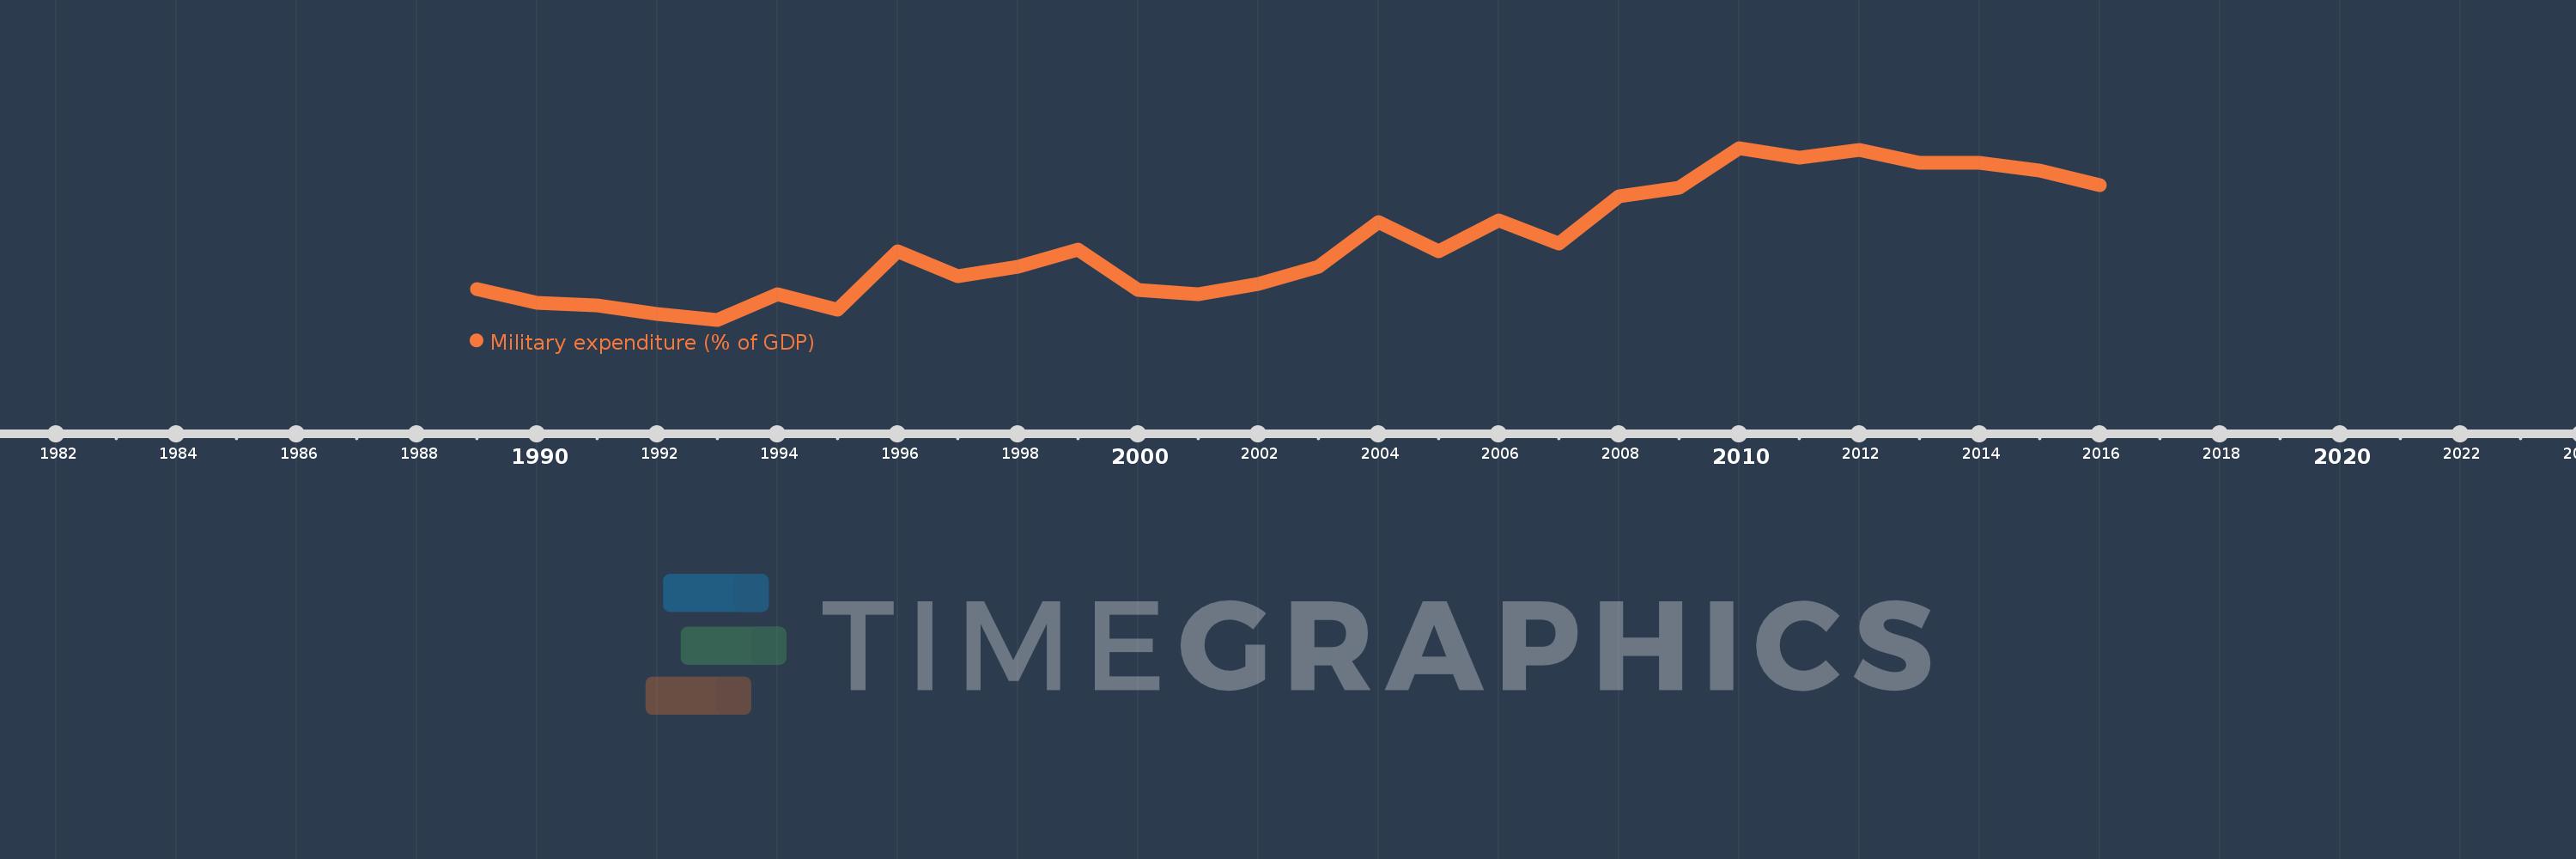
Military expenditure (% of GDP)
2016,2015,2014,2013,2012,2011,2010,2009,2008,2007,2006,2005,2004,2003,2002,2001,2000,1999,1998,1997,1996,1995,1994,1993,1992,1991,1990,1989
This statistics in other country:
Timeline:
This timeline shows a graph from 1989 to 2016 of Ecuador. No data until 1988. Number of actual observations by date: 28.
Source name:
World Development Indicators
Source organization:
Stockholm International Peace Research Institute (SIPRI), Yearbook: Armaments, Disarmament and International Security.
Categories, topics:
Public Sector
Last updated:
apr 23, 2017
Indicators value changes by year
At the date of observation
Value
Absolute change
Change from previous value
jan 1, 1989
1.518
+1.518
0.0%
jan 1, 1990
1.361
-0.156
-10.31%
jan 1, 1991
1.326
-0.035
-2.58%
jan 1, 1992
1.231
-0.095
-7.19%
jan 1, 1993
1.167
-0.064
-5.21%
jan 1, 1994
1.458
+0.291
24.97%
jan 1, 1995
1.282
-0.176
-12.07%
jan 1, 1996
1.945
+0.663
51.71%
jan 1, 1997
1.662
-0.283
-14.56%
jan 1, 1998
1.773
+0.111
6.68%
jan 1, 1999
1.963
+0.19
10.73%
jan 1, 2000
1.507
-0.455
-23.2%
jan 1, 2001
1.452
-0.055
-3.68%
jan 1, 2002
1.569
+0.117
8.08%
jan 1, 2003
1.769
+0.2
12.71%
jan 1, 2004
2.279
+0.51
28.81%
jan 1, 2005
1.94
-0.338
-14.84%
jan 1, 2006
2.298
+0.358
18.45%
jan 1, 2007
2.03
-0.269
-11.69%
jan 1, 2008
2.568
+0.538
26.52%
jan 1, 2009
2.665
+0.097
3.77%
jan 1, 2010
3.117
+0.452
16.97%
jan 1, 2011
3.011
-0.107
-3.43%
jan 1, 2012
3.095
+0.085
2.81%
jan 1, 2013
2.945
-0.15
-4.84%
jan 1, 2014
2.947
+0.002
0.06%
jan 1, 2015
2.857
-0.09
-3.07%
jan 1, 2016
2.693
-0.164
-5.75%
Ranking of countries by current statistics by years


Comments: