29
/
en
AIzaSyAYiBZKx7MnpbEhh9jyipgxe19OcubqV5w
April 1, 2024
50235
Middle East & North Africa (IDA & IBRD countries)
TMN
false
2
1
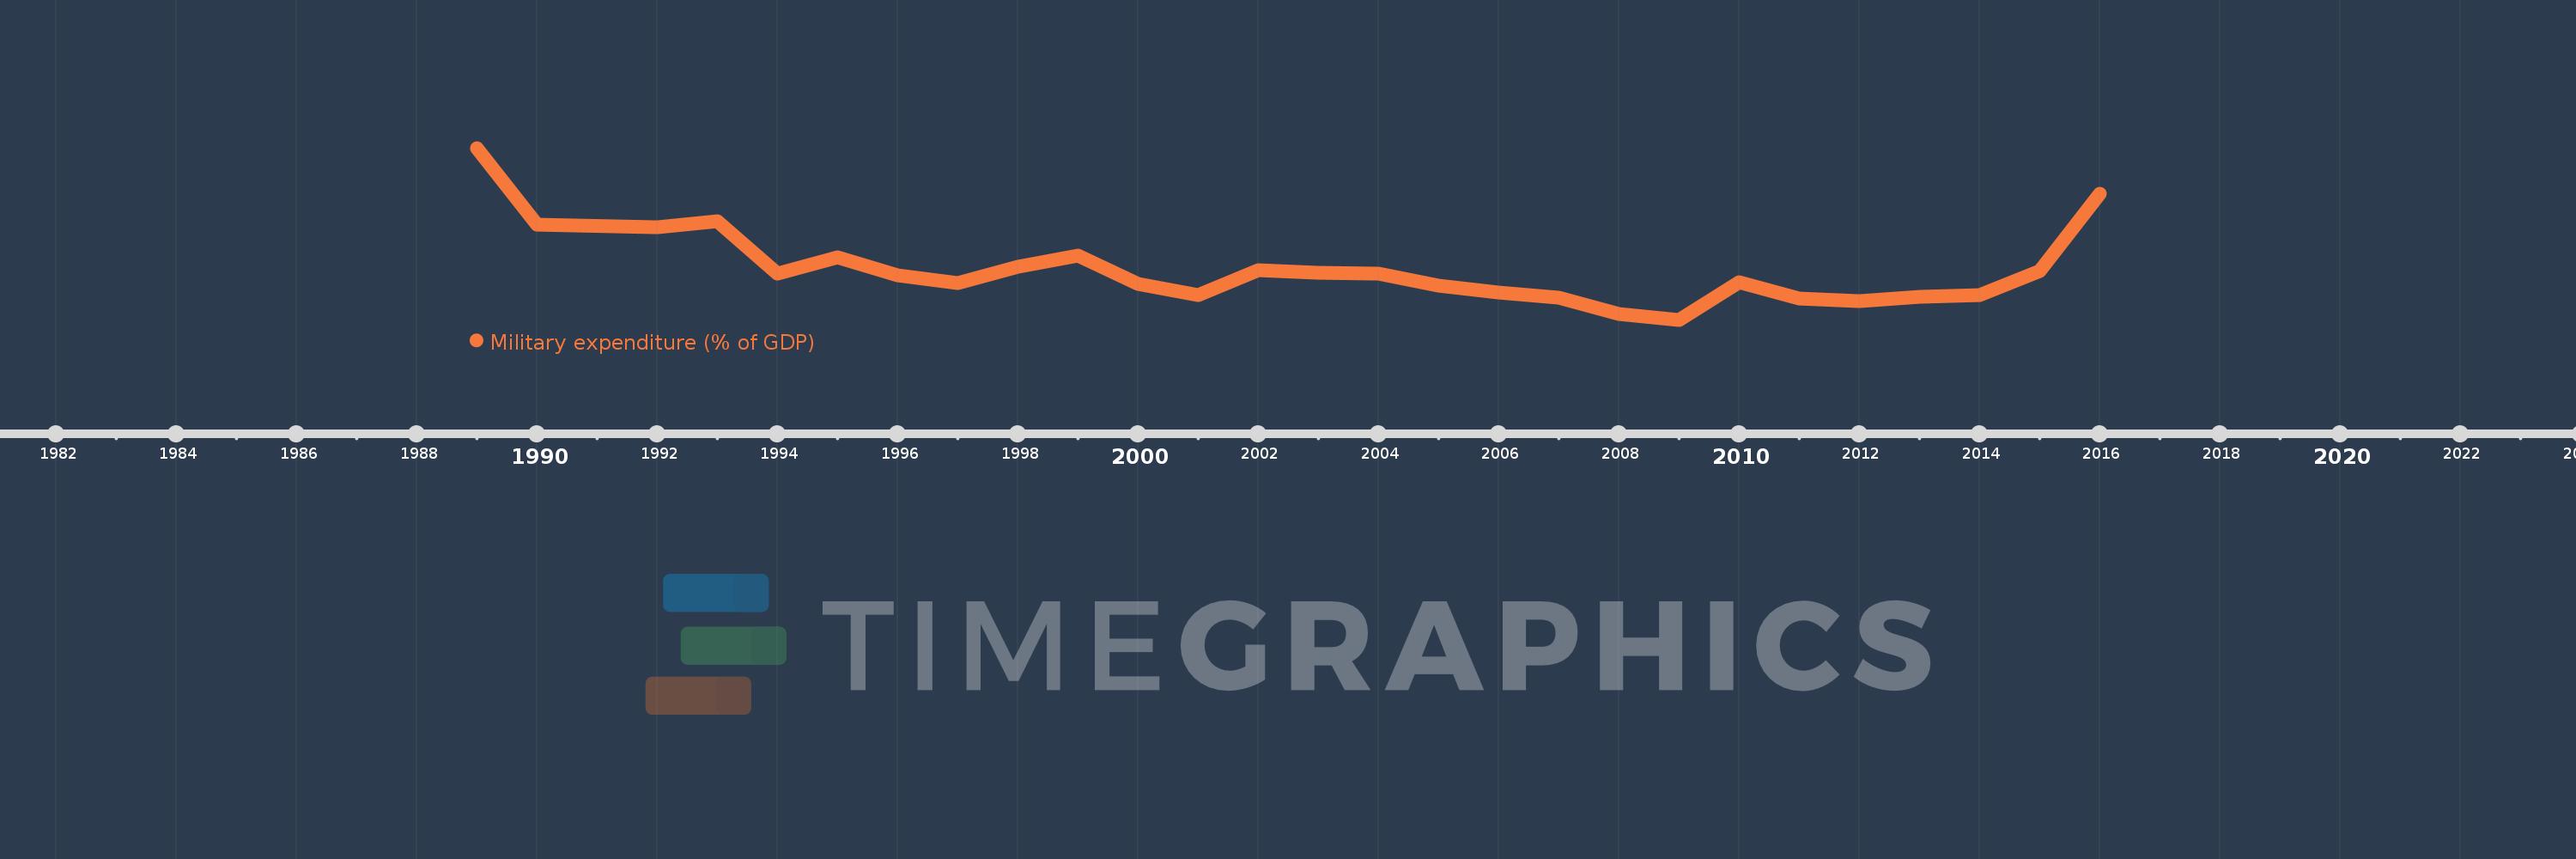
Military expenditure (% of GDP)
2016,2015,2014,2013,2012,2011,2010,2009,2008,2007,2006,2005,2004,2003,2002,2001,2000,1999,1998,1997,1996,1995,1994,1993,1992,1990,1989
This statistics in other country:
Timeline:
This timeline shows a graph from 1989 to 2016 of Middle East & North Africa (IDA & IBRD countries). No data until 1988. Number of actual observations by date: 27.
Source name:
World Development Indicators
Source organization:
Stockholm International Peace Research Institute (SIPRI), Yearbook: Armaments, Disarmament and International Security.
Categories, topics:
Public Sector
Last updated:
apr 23, 2017
Indicators value changes by year
At the date of observation
Value
Absolute change
Change from previous value
jan 1, 1989
4.654
+4.654
0.0%
jan 1, 1990
3.768
-0.886
-19.03%
jan 1, 1992
3.74
-0.028
-0.74%
jan 1, 1993
3.817
+0.077
2.05%
jan 1, 1994
3.214
-0.602
-15.78%
jan 1, 1995
3.394
+0.179
5.58%
jan 1, 1996
3.186
-0.208
-6.12%
jan 1, 1997
3.102
-0.084
-2.64%
jan 1, 1998
3.287
+0.185
5.96%
jan 1, 1999
3.413
+0.126
3.84%
jan 1, 2000
3.093
-0.32
-9.38%
jan 1, 2001
2.964
-0.129
-4.17%
jan 1, 2002
3.25
+0.286
9.64%
jan 1, 2003
3.219
-0.031
-0.95%
jan 1, 2004
3.206
-0.013
-0.41%
jan 1, 2005
3.07
-0.136
-4.23%
jan 1, 2006
2.989
-0.081
-2.64%
jan 1, 2007
2.929
-0.06
-2.02%
jan 1, 2008
2.745
-0.184
-6.28%
jan 1, 2009
2.68
-0.065
-2.35%
jan 1, 2010
3.113
+0.432
16.14%
jan 1, 2011
2.923
-0.189
-6.09%
jan 1, 2012
2.891
-0.032
-1.1%
jan 1, 2013
2.942
+0.051
1.77%
jan 1, 2014
2.96
+0.018
0.61%
jan 1, 2015
3.235
+0.275
9.29%
jan 1, 2016
4.123
+0.888
27.44%
Ranking of countries by current statistics by years


Comments: