29
/
en
AIzaSyAYiBZKx7MnpbEhh9jyipgxe19OcubqV5w
April 1, 2024
154917
India
IND
true
2
1
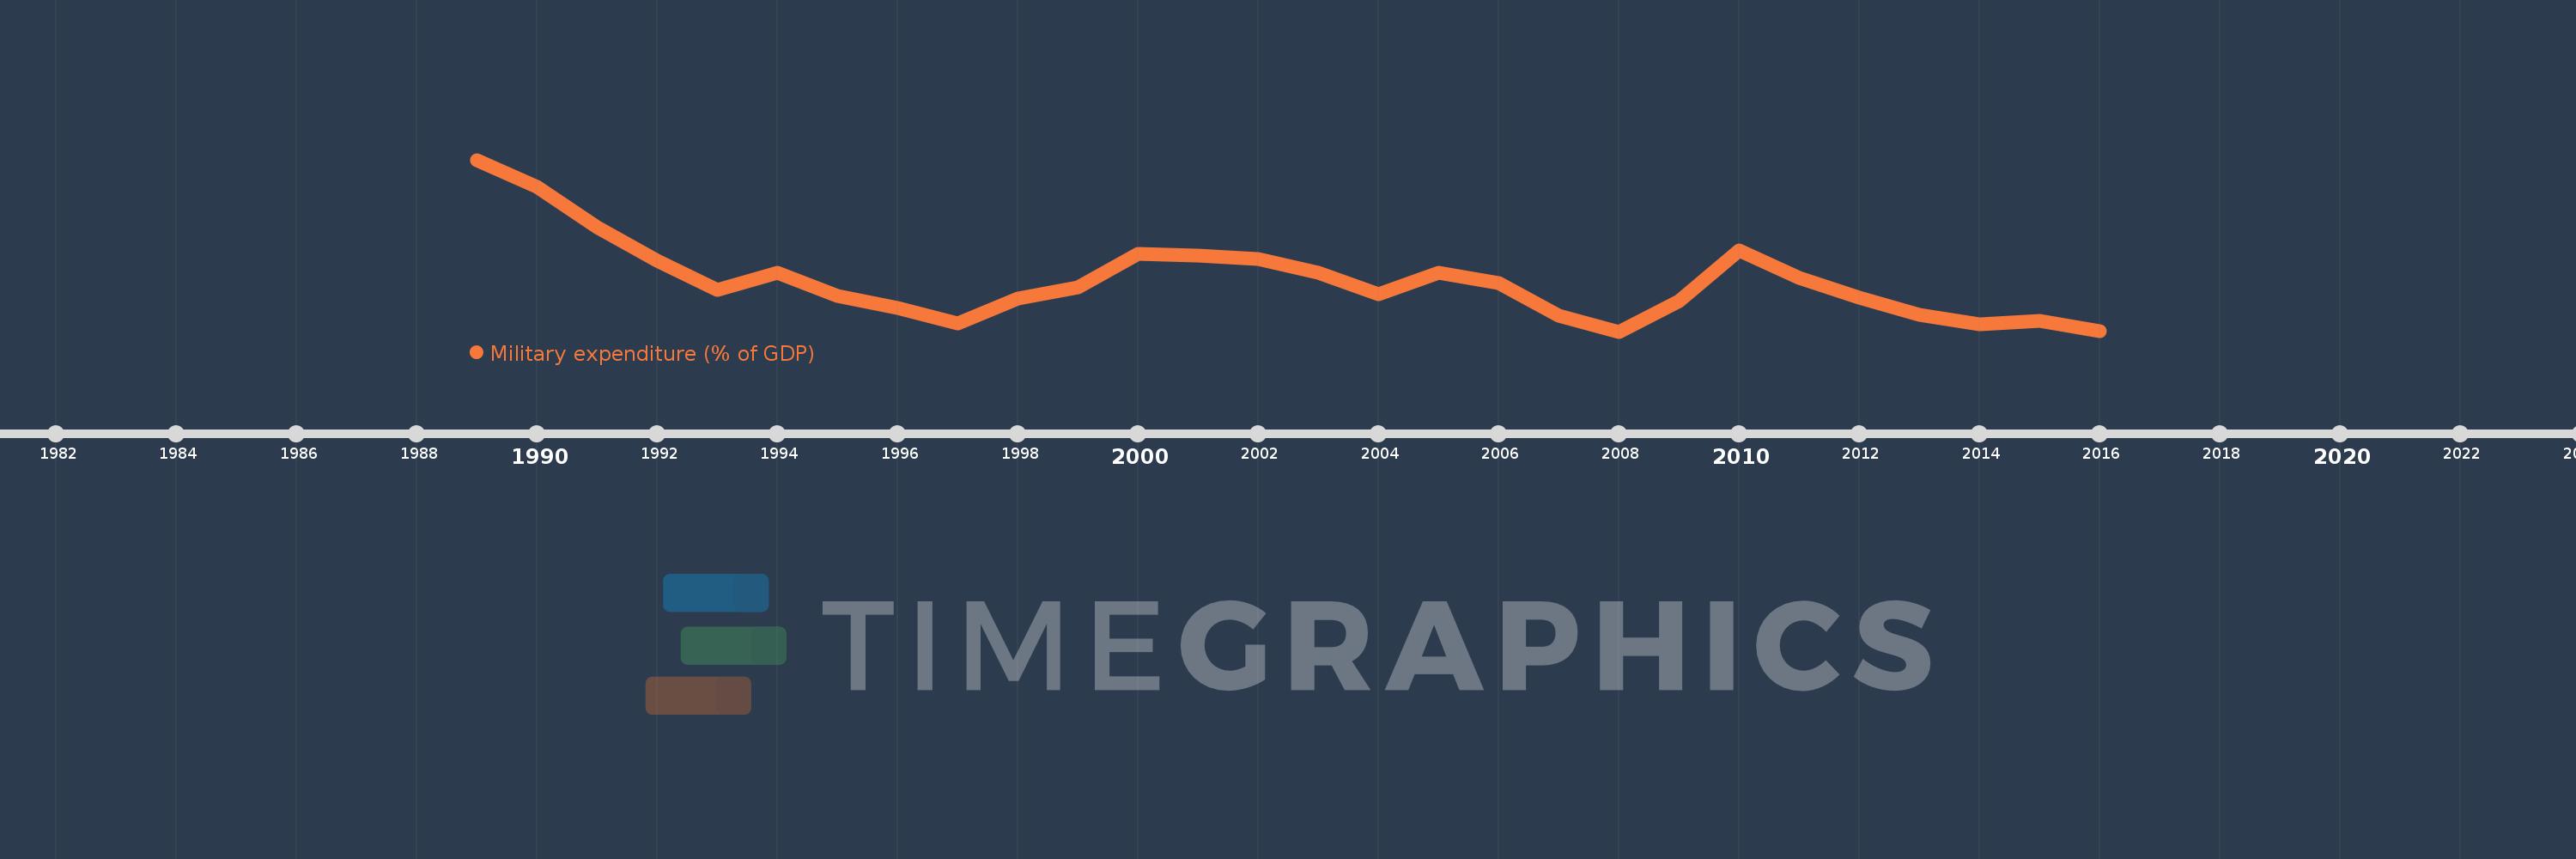
Military expenditure (% of GDP)
2016,2015,2014,2013,2012,2011,2010,2009,2008,2007,2006,2005,2004,2003,2002,2001,2000,1999,1998,1997,1996,1995,1994,1993,1992,1991,1990,1989
This statistics in other country:
Timeline:
This timeline shows a graph from 1989 to 2016 of India. No data until 1988. Number of actual observations by date: 28.
Source name:
World Development Indicators
Source organization:
Stockholm International Peace Research Institute (SIPRI), Yearbook: Armaments, Disarmament and International Security.
Categories, topics:
Public Sector
Last updated:
apr 23, 2017
Indicators value changes by year
At the date of observation
Value
Absolute change
Change from previous value
jan 1, 1989
3.614
+3.614
0.0%
jan 1, 1990
3.423
-0.191
-5.29%
jan 1, 1991
3.146
-0.277
-8.09%
jan 1, 1992
2.91
-0.236
-7.51%
jan 1, 1993
2.705
-0.205
-7.05%
jan 1, 1994
2.824
+0.119
4.39%
jan 1, 1995
2.665
-0.159
-5.63%
jan 1, 1996
2.578
-0.086
-3.23%
jan 1, 1997
2.473
-0.106
-4.1%
jan 1, 1998
2.648
+0.175
7.08%
jan 1, 1999
2.727
+0.08
3.01%
jan 1, 2000
2.957
+0.23
8.43%
jan 1, 2001
2.949
-0.008
-0.28%
jan 1, 2002
2.924
-0.024
-0.83%
jan 1, 2003
2.827
-0.098
-3.34%
jan 1, 2004
2.678
-0.149
-5.27%
jan 1, 2005
2.829
+0.151
5.64%
jan 1, 2006
2.755
-0.074
-2.61%
jan 1, 2007
2.527
-0.228
-8.28%
jan 1, 2008
2.416
-0.111
-4.38%
jan 1, 2009
2.63
+0.214
8.86%
jan 1, 2010
2.984
+0.354
13.46%
jan 1, 2011
2.792
-0.192
-6.43%
jan 1, 2012
2.652
-0.141
-5.04%
jan 1, 2013
2.535
-0.116
-4.38%
jan 1, 2014
2.464
-0.071
-2.81%
jan 1, 2015
2.488
+0.024
0.98%
jan 1, 2016
2.421
-0.067
-2.68%
Ranking of countries by current statistics by years


Comments: