29
/
en
AIzaSyAYiBZKx7MnpbEhh9jyipgxe19OcubqV5w
April 1, 2024
51582
Middle income
MIC
false
2
1
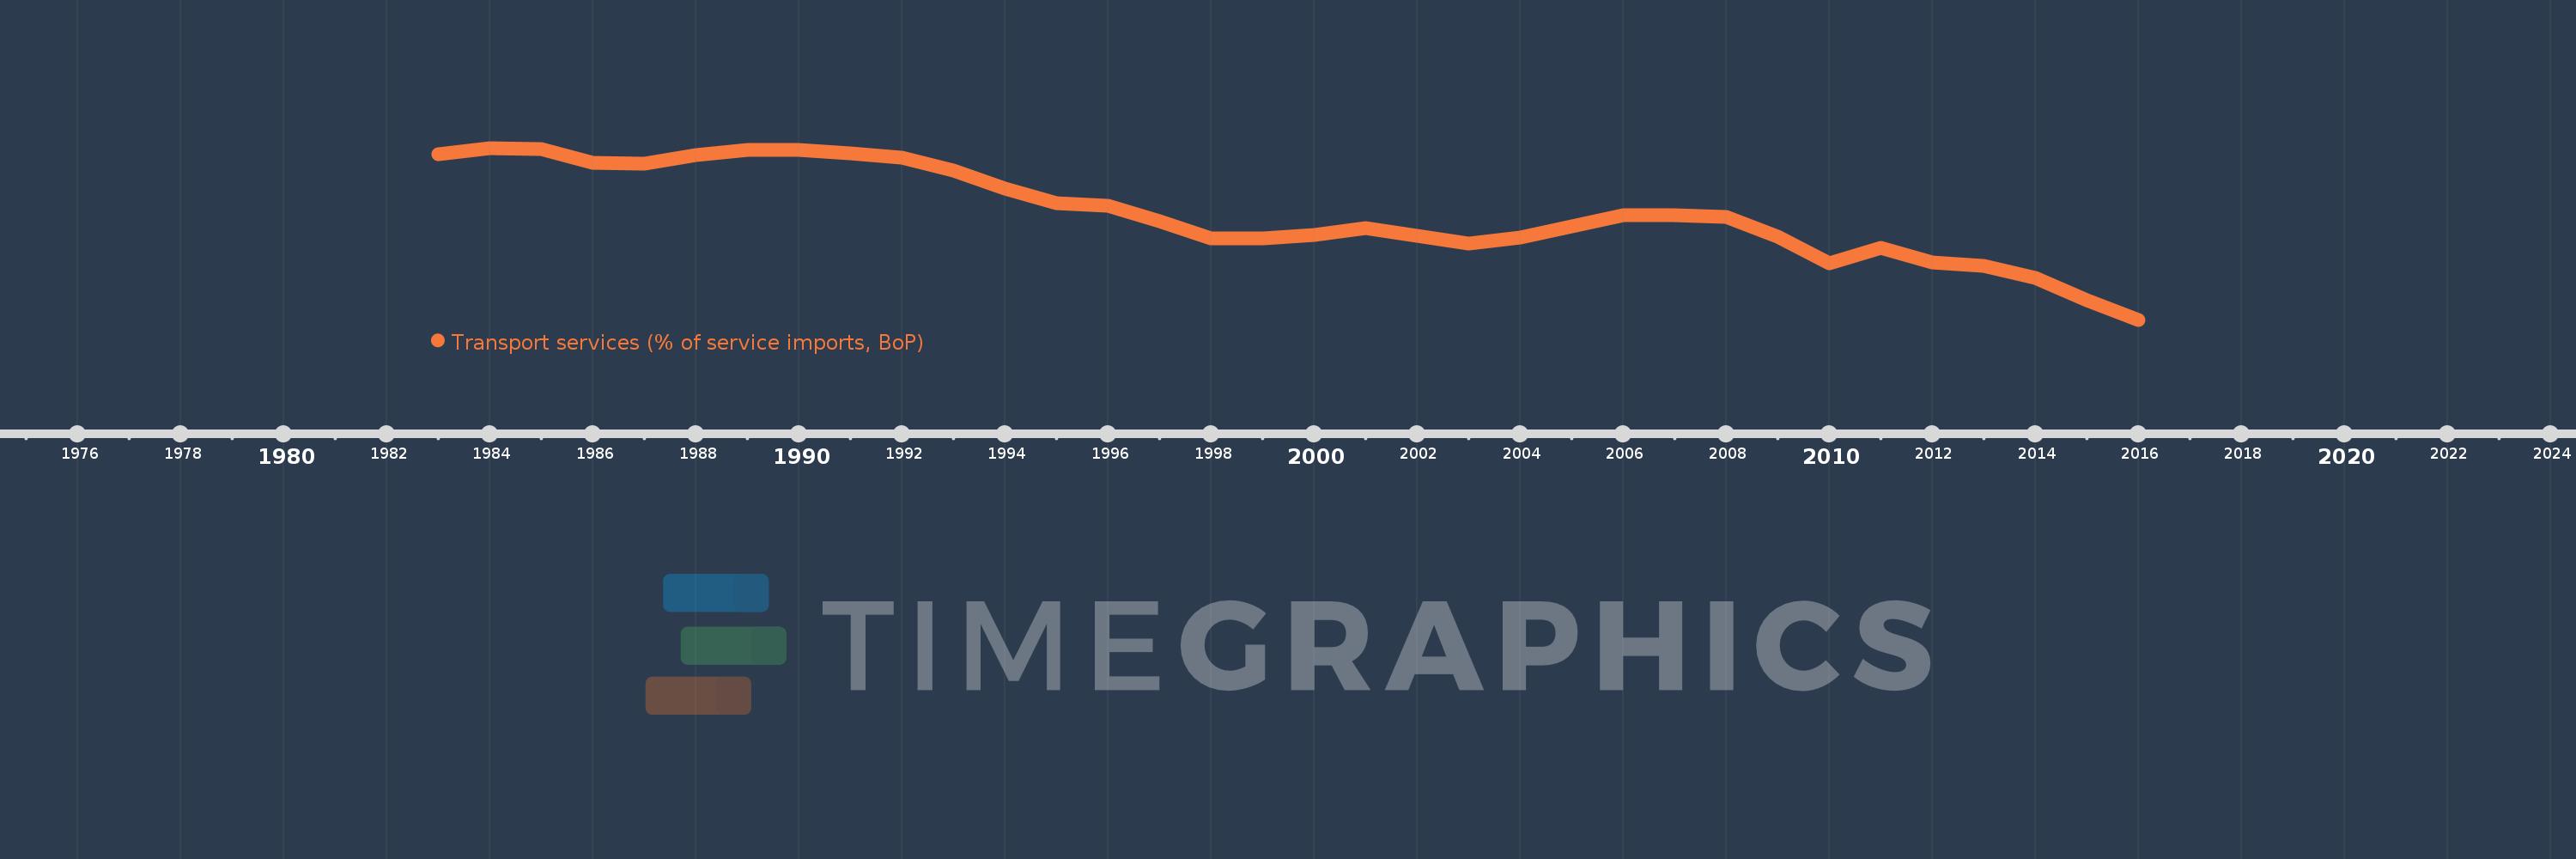
Transport services (% of service imports, BoP)
2016,2015,2014,2013,2012,2011,2010,2009,2008,2007,2006,2005,2004,2003,2002,2001,2000,1999,1998,1997,1996,1995,1994,1993,1992,1991,1990,1989,1988,1987,1986,1985,1984,1983
This statistics in other country:
AfghanistanAlbaniaAlgeriaAngolaAntigua and BarbudaArab WorldArgentinaArmeniaArubaAustraliaAustriaAzerbaijanBahamas, TheBahrainBangladeshBarbadosBelarusBelgiumBelizeBeninBermudaBhutanBoliviaBosnia and HerzegovinaBotswanaBrazilBrunei DarussalamBulgariaBurkina FasoBurundiCabo VerdeCambodiaCameroonCanadaCaribbean small statesCentral African RepublicCentral Europe and the BalticsChadChileChinaColombiaComorosCongo, Dem. Rep.Congo, Rep.Costa RicaCote d'IvoireCroatiaCuracaoCyprusCzech RepublicDenmarkDjiboutiDominicaDominican RepublicEarly-demographic dividendEast Asia & PacificEast Asia & Pacific (excluding high income)East Asia & Pacific (IDA & IBRD countries)EcuadorEgypt, Arab Rep.El SalvadorEquatorial GuineaEritreaEstoniaEthiopiaEuro areaEurope & Central AsiaEurope & Central Asia (excluding high income)Europe & Central Asia (IDA & IBRD countries)European UnionFaroe IslandsFijiFinlandFragile and conflict affected situationsFranceFrench PolynesiaGabonGambia, TheGeorgiaGermanyGhanaGreeceGrenadaGuatemalaGuineaGuinea-BissauGuyanaHaitiHeavily indebted poor countries (HIPC)High incomeHondurasHong Kong SAR, ChinaHungaryIBRD onlyIcelandIDA & IBRD totalIDA onlyIDA totalIndiaIndonesiaIran, Islamic Rep.IraqIrelandIsraelItalyJamaicaJapanJordanKazakhstanKenyaKiribatiKorea, Rep.KosovoKuwaitKyrgyz RepublicLao PDRLate-demographic dividendLatin America & Caribbean Latin America & Caribbean (excluding high income)Latin America & the Caribbean (IDA & IBRD countries)LatviaLeast developed countries: UN classificationLebanonLesothoLiberiaLibyaLithuaniaLow & middle incomeLow incomeLower middle incomeLuxembourgMacao SAR, ChinaMacedonia, FYRMadagascarMalawiMalaysiaMaldivesMaliMaltaMarshall IslandsMauritaniaMauritiusMexicoMicronesia, Fed. Sts.Middle East & North AfricaMiddle East & North Africa (excluding high income)Middle East & North Africa (IDA & IBRD countries)Middle incomeMoldovaMongoliaMontenegroMoroccoMozambiqueMyanmarNamibiaNepalNetherlandsNew CaledoniaNew ZealandNicaraguaNigerNigeriaNorth AmericaNorwayOECD membersOmanOther small statesPacific island small statesPakistanPalauPanamaPapua New GuineaParaguayPeruPhilippinesPolandPortugalPost-demographic dividendPre-demographic dividendQatarRomaniaRussian FederationRwandaSamoaSao Tome and PrincipeSaudi ArabiaSenegalSerbiaSeychellesSierra LeoneSingaporeSint Maarten (Dutch part)Slovak RepublicSloveniaSmall statesSolomon IslandsSouth AfricaSouth AsiaSouth Asia (IDA & IBRD)South SudanSpainSri LankaSt. Kitts and NevisSt. LuciaSt. Vincent and the GrenadinesSub-Saharan Africa Sub-Saharan Africa (excluding high income)Sub-Saharan Africa (IDA & IBRD countries)SudanSurinameSwazilandSwedenSwitzerlandSyrian Arab RepublicTajikistanTanzaniaThailandTimor-LesteTogoTongaTrinidad and TobagoTunisiaTurkeyTuvaluUgandaUkraineUnited KingdomUnited StatesUpper middle incomeUruguayVanuatuVenezuela, RBWest Bank and GazaWorldYemen, Rep.ZambiaZimbabwe Timeline:
This timeline shows a graph from 1983 to 2016 of Middle income. No data until 1982. Number of actual observations by date: 34.
Source name:
World Development Indicators
Source organization:
International Monetary Fund, Balance of Payments Statistics Yearbook and data files.
Categories, topics:
Economy & Growth, Trade
Last updated:
apr 23, 2017
Indicators value changes by year
Minimum:
21.719
jan 1, 2016
Maximum:
43.721
jan 1, 1984
At the date of observation
Value
Absolute change
Change from previous value
jan 1, 1983
42.936
+42.936
0.0%
jan 1, 1984
43.721
+0.786
1.83%
jan 1, 1985
43.554
-0.167
-0.38%
jan 1, 1986
41.824
-1.73
-3.97%
jan 1, 1987
41.673
-0.15
-0.36%
jan 1, 1988
42.839
+1.166
2.8%
jan 1, 1989
43.515
+0.676
1.58%
jan 1, 1990
43.489
-0.025
-0.06%
jan 1, 1991
43.002
-0.487
-1.12%
jan 1, 1992
42.525
-0.477
-1.11%
jan 1, 1993
40.827
-1.698
-3.99%
jan 1, 1994
38.484
-2.343
-5.74%
jan 1, 1995
36.692
-1.792
-4.66%
jan 1, 1996
36.323
-0.369
-1.01%
jan 1, 1997
34.325
-1.998
-5.5%
jan 1, 1998
32.165
-2.16
-6.29%
jan 1, 1999
32.138
-0.027
-0.08%
jan 1, 2000
32.607
+0.469
1.46%
jan 1, 2001
33.485
+0.878
2.69%
jan 1, 2002
32.466
-1.018
-3.04%
jan 1, 2003
31.528
-0.939
-2.89%
jan 1, 2004
32.25
+0.723
2.29%
jan 1, 2005
33.638
+1.387
4.3%
jan 1, 2006
35.08
+1.442
4.29%
jan 1, 2007
35.132
+0.052
0.15%
jan 1, 2008
34.866
-0.266
-0.76%
jan 1, 2009
32.338
-2.528
-7.25%
jan 1, 2010
28.914
-3.424
-10.59%
jan 1, 2011
30.905
+1.991
6.88%
jan 1, 2012
29.102
-1.803
-5.83%
jan 1, 2013
28.648
-0.454
-1.56%
jan 1, 2014
27.088
-1.561
-5.45%
jan 1, 2015
24.262
-2.826
-10.43%
jan 1, 2016
21.719
-2.543
-10.48%
Ranking of countries by current statistics by years


Comments: