29
/
en
AIzaSyAYiBZKx7MnpbEhh9jyipgxe19OcubqV5w
April 1, 2024
162072
Italy
ITA
true
2
1
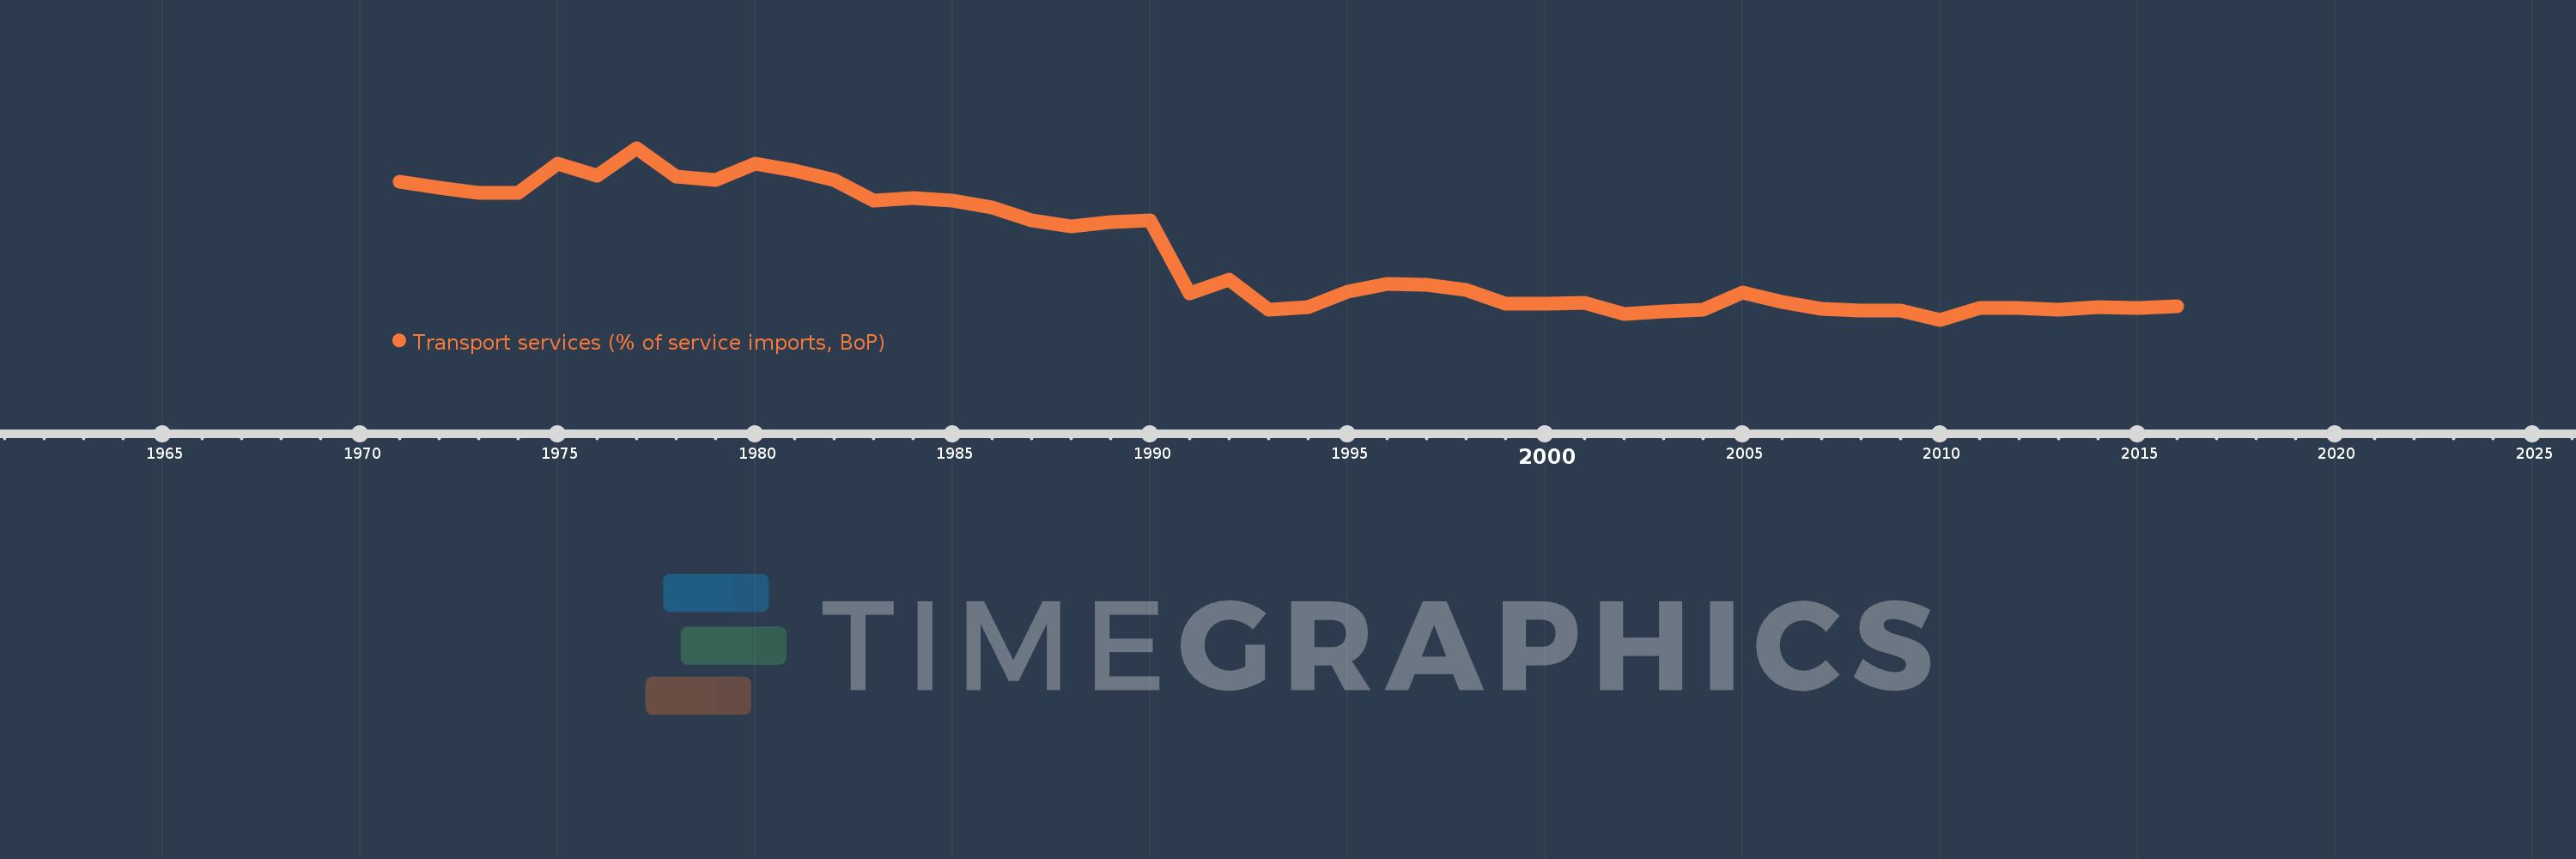
Transport services (% of service imports, BoP)
2016,2015,2014,2013,2012,2011,2010,2009,2008,2007,2006,2005,2004,2003,2002,2001,2000,1999,1998,1997,1996,1995,1994,1993,1992,1991,1990,1989,1988,1987,1986,1985,1984,1983,1982,1981,1980,1979,1978,1977,1976,1975,1974,1973,1972,1971
This statistics in other country:
AfghanistanAlbaniaAlgeriaAngolaAntigua and BarbudaArab WorldArgentinaArmeniaArubaAustraliaAustriaAzerbaijanBahamas, TheBahrainBangladeshBarbadosBelarusBelgiumBelizeBeninBermudaBhutanBoliviaBosnia and HerzegovinaBotswanaBrazilBrunei DarussalamBulgariaBurkina FasoBurundiCabo VerdeCambodiaCameroonCanadaCaribbean small statesCentral African RepublicCentral Europe and the BalticsChadChileChinaColombiaComorosCongo, Dem. Rep.Congo, Rep.Costa RicaCote d'IvoireCroatiaCuracaoCyprusCzech RepublicDenmarkDjiboutiDominicaDominican RepublicEarly-demographic dividendEast Asia & PacificEast Asia & Pacific (excluding high income)East Asia & Pacific (IDA & IBRD countries)EcuadorEgypt, Arab Rep.El SalvadorEquatorial GuineaEritreaEstoniaEthiopiaEuro areaEurope & Central AsiaEurope & Central Asia (excluding high income)Europe & Central Asia (IDA & IBRD countries)European UnionFaroe IslandsFijiFinlandFragile and conflict affected situationsFranceFrench PolynesiaGabonGambia, TheGeorgiaGermanyGhanaGreeceGrenadaGuatemalaGuineaGuinea-BissauGuyanaHaitiHeavily indebted poor countries (HIPC)High incomeHondurasHong Kong SAR, ChinaHungaryIBRD onlyIcelandIDA & IBRD totalIDA onlyIDA totalIndiaIndonesiaIran, Islamic Rep.IraqIrelandIsraelItalyJamaicaJapanJordanKazakhstanKenyaKiribatiKorea, Rep.KosovoKuwaitKyrgyz RepublicLao PDRLate-demographic dividendLatin America & Caribbean Latin America & Caribbean (excluding high income)Latin America & the Caribbean (IDA & IBRD countries)LatviaLeast developed countries: UN classificationLebanonLesothoLiberiaLibyaLithuaniaLow & middle incomeLow incomeLower middle incomeLuxembourgMacao SAR, ChinaMacedonia, FYRMadagascarMalawiMalaysiaMaldivesMaliMaltaMarshall IslandsMauritaniaMauritiusMexicoMicronesia, Fed. Sts.Middle East & North AfricaMiddle East & North Africa (excluding high income)Middle East & North Africa (IDA & IBRD countries)Middle incomeMoldovaMongoliaMontenegroMoroccoMozambiqueMyanmarNamibiaNepalNetherlandsNew CaledoniaNew ZealandNicaraguaNigerNigeriaNorth AmericaNorwayOECD membersOmanOther small statesPacific island small statesPakistanPalauPanamaPapua New GuineaParaguayPeruPhilippinesPolandPortugalPost-demographic dividendPre-demographic dividendQatarRomaniaRussian FederationRwandaSamoaSao Tome and PrincipeSaudi ArabiaSenegalSerbiaSeychellesSierra LeoneSingaporeSint Maarten (Dutch part)Slovak RepublicSloveniaSmall statesSolomon IslandsSouth AfricaSouth AsiaSouth Asia (IDA & IBRD)South SudanSpainSri LankaSt. Kitts and NevisSt. LuciaSt. Vincent and the GrenadinesSub-Saharan Africa Sub-Saharan Africa (excluding high income)Sub-Saharan Africa (IDA & IBRD countries)SudanSurinameSwazilandSwedenSwitzerlandSyrian Arab RepublicTajikistanTanzaniaThailandTimor-LesteTogoTongaTrinidad and TobagoTunisiaTurkeyTuvaluUgandaUkraineUnited KingdomUnited StatesUpper middle incomeUruguayVanuatuVenezuela, RBWest Bank and GazaWorldYemen, Rep.ZambiaZimbabwe Timeline:
This timeline shows a graph from 1971 to 2016 of Italy. No data until 1970. Number of actual observations by date: 46.
Source name:
World Development Indicators
Source organization:
International Monetary Fund, Balance of Payments Statistics Yearbook and data files.
Categories, topics:
Economy & Growth, Trade
Last updated:
apr 23, 2017
Indicators value changes by year
Minimum:
20.907
jan 1, 2010
Maximum:
53.593
jan 1, 1977
At the date of observation
Value
Absolute change
Change from previous value
jan 1, 1971
47.227
+47.227
0.0%
jan 1, 1972
46.096
-1.132
-2.4%
jan 1, 1973
45.001
-1.095
-2.38%
jan 1, 1974
45.02
+0.02
0.04%
jan 1, 1975
50.537
+5.517
12.25%
jan 1, 1976
48.276
-2.261
-4.47%
jan 1, 1977
53.593
+5.317
11.01%
jan 1, 1978
48.139
-5.454
-10.18%
jan 1, 1979
47.501
-0.638
-1.32%
jan 1, 1980
50.571
+3.07
6.46%
jan 1, 1981
49.248
-1.323
-2.62%
jan 1, 1982
47.449
-1.799
-3.65%
jan 1, 1983
43.5
-3.949
-8.32%
jan 1, 1984
44.027
+0.527
1.21%
jan 1, 1985
43.593
-0.434
-0.99%
jan 1, 1986
42.289
-1.303
-2.99%
jan 1, 1987
39.837
-2.452
-5.8%
jan 1, 1988
38.73
-1.107
-2.78%
jan 1, 1989
39.492
+0.762
1.97%
jan 1, 1990
39.894
+0.402
1.02%
jan 1, 1991
25.923
-13.971
-35.02%
jan 1, 1992
28.462
+2.54
9.8%
jan 1, 1993
22.765
-5.697
-20.02%
jan 1, 1994
23.372
+0.607
2.67%
jan 1, 1995
26.213
+2.841
12.15%
jan 1, 1996
27.75
+1.537
5.86%
jan 1, 1997
27.492
-0.258
-0.93%
jan 1, 1998
26.559
-0.932
-3.39%
jan 1, 1999
24.039
-2.52
-9.49%
jan 1, 2000
23.908
-0.131
-0.54%
jan 1, 2001
24.153
+0.244
1.02%
jan 1, 2002
21.989
-2.163
-8.96%
jan 1, 2003
22.494
+0.505
2.3%
jan 1, 2004
22.844
+0.351
1.56%
jan 1, 2005
26.017
+3.173
13.89%
jan 1, 2006
24.278
-1.738
-6.68%
jan 1, 2007
22.912
-1.367
-5.63%
jan 1, 2008
22.73
-0.182
-0.79%
jan 1, 2009
22.736
+0.006
0.03%
jan 1, 2010
20.907
-1.829
-8.05%
jan 1, 2011
23.157
+2.25
10.76%
jan 1, 2012
23.135
-0.022
-0.09%
jan 1, 2013
22.844
-0.291
-1.26%
jan 1, 2014
23.39
+0.545
2.39%
jan 1, 2015
23.202
-0.188
-0.8%
jan 1, 2016
23.433
+0.231
1.0%
Ranking of countries by current statistics by years


Comments: