29
/
en
AIzaSyAYiBZKx7MnpbEhh9jyipgxe19OcubqV5w
April 1, 2024
141238
Ghana
GHA
true
2
1
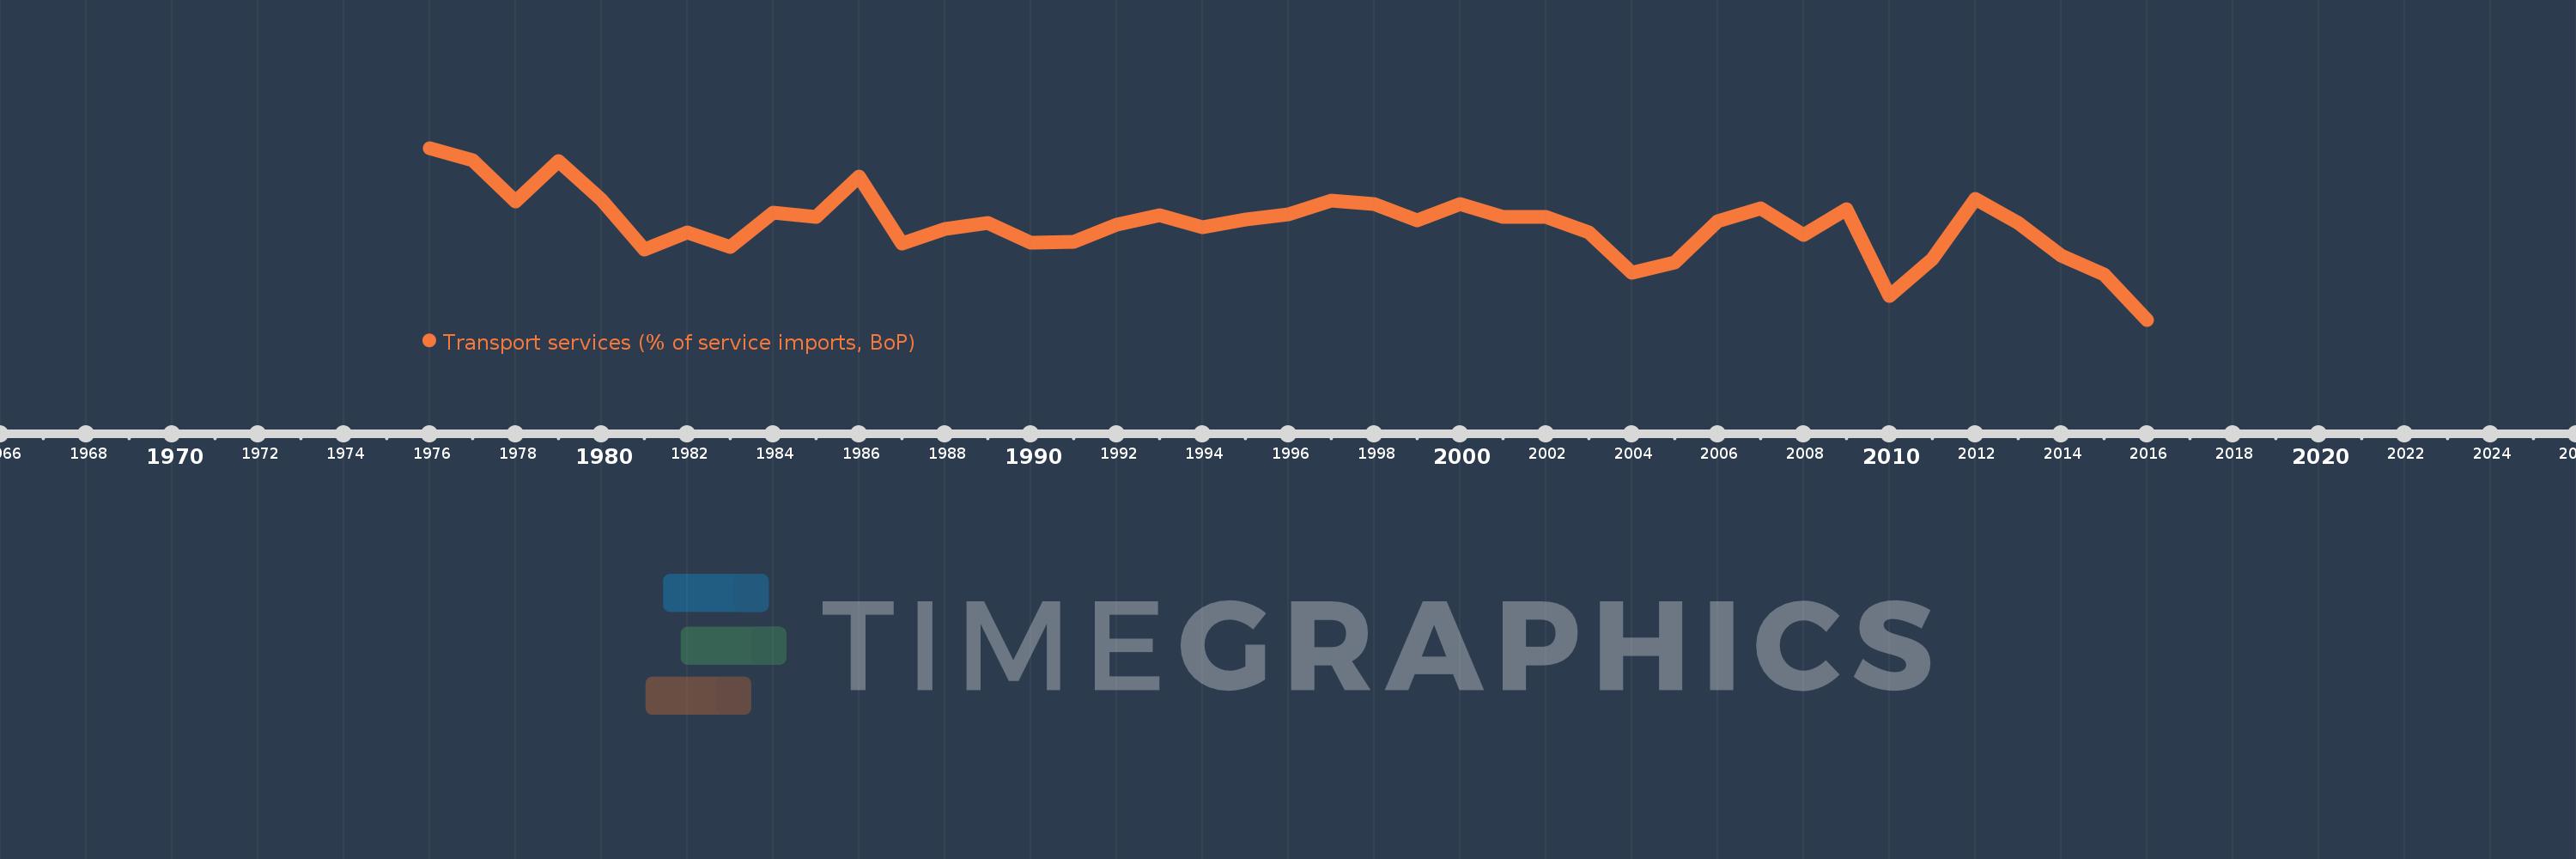
Transport services (% of service imports, BoP)
2016,2015,2014,2013,2012,2011,2010,2009,2008,2007,2006,2005,2004,2003,2002,2001,2000,1999,1998,1997,1996,1995,1994,1993,1992,1991,1990,1989,1988,1987,1986,1985,1984,1983,1982,1981,1980,1979,1978,1977,1976
This statistics in other country:
AfghanistanAlbaniaAlgeriaAngolaAntigua and BarbudaArab WorldArgentinaArmeniaArubaAustraliaAustriaAzerbaijanBahamas, TheBahrainBangladeshBarbadosBelarusBelgiumBelizeBeninBermudaBhutanBoliviaBosnia and HerzegovinaBotswanaBrazilBrunei DarussalamBulgariaBurkina FasoBurundiCabo VerdeCambodiaCameroonCanadaCaribbean small statesCentral African RepublicCentral Europe and the BalticsChadChileChinaColombiaComorosCongo, Dem. Rep.Congo, Rep.Costa RicaCote d'IvoireCroatiaCuracaoCyprusCzech RepublicDenmarkDjiboutiDominicaDominican RepublicEarly-demographic dividendEast Asia & PacificEast Asia & Pacific (excluding high income)East Asia & Pacific (IDA & IBRD countries)EcuadorEgypt, Arab Rep.El SalvadorEquatorial GuineaEritreaEstoniaEthiopiaEuro areaEurope & Central AsiaEurope & Central Asia (excluding high income)Europe & Central Asia (IDA & IBRD countries)European UnionFaroe IslandsFijiFinlandFragile and conflict affected situationsFranceFrench PolynesiaGabonGambia, TheGeorgiaGermanyGhanaGreeceGrenadaGuatemalaGuineaGuinea-BissauGuyanaHaitiHeavily indebted poor countries (HIPC)High incomeHondurasHong Kong SAR, ChinaHungaryIBRD onlyIcelandIDA & IBRD totalIDA onlyIDA totalIndiaIndonesiaIran, Islamic Rep.IraqIrelandIsraelItalyJamaicaJapanJordanKazakhstanKenyaKiribatiKorea, Rep.KosovoKuwaitKyrgyz RepublicLao PDRLate-demographic dividendLatin America & Caribbean Latin America & Caribbean (excluding high income)Latin America & the Caribbean (IDA & IBRD countries)LatviaLeast developed countries: UN classificationLebanonLesothoLiberiaLibyaLithuaniaLow & middle incomeLow incomeLower middle incomeLuxembourgMacao SAR, ChinaMacedonia, FYRMadagascarMalawiMalaysiaMaldivesMaliMaltaMarshall IslandsMauritaniaMauritiusMexicoMicronesia, Fed. Sts.Middle East & North AfricaMiddle East & North Africa (excluding high income)Middle East & North Africa (IDA & IBRD countries)Middle incomeMoldovaMongoliaMontenegroMoroccoMozambiqueMyanmarNamibiaNepalNetherlandsNew CaledoniaNew ZealandNicaraguaNigerNigeriaNorth AmericaNorwayOECD membersOmanOther small statesPacific island small statesPakistanPalauPanamaPapua New GuineaParaguayPeruPhilippinesPolandPortugalPost-demographic dividendPre-demographic dividendQatarRomaniaRussian FederationRwandaSamoaSao Tome and PrincipeSaudi ArabiaSenegalSerbiaSeychellesSierra LeoneSingaporeSint Maarten (Dutch part)Slovak RepublicSloveniaSmall statesSolomon IslandsSouth AfricaSouth AsiaSouth Asia (IDA & IBRD)South SudanSpainSri LankaSt. Kitts and NevisSt. LuciaSt. Vincent and the GrenadinesSub-Saharan Africa Sub-Saharan Africa (excluding high income)Sub-Saharan Africa (IDA & IBRD countries)SudanSurinameSwazilandSwedenSwitzerlandSyrian Arab RepublicTajikistanTanzaniaThailandTimor-LesteTogoTongaTrinidad and TobagoTunisiaTurkeyTuvaluUgandaUkraineUnited KingdomUnited StatesUpper middle incomeUruguayVanuatuVenezuela, RBWest Bank and GazaWorldYemen, Rep.ZambiaZimbabwe Timeline:
This timeline shows a graph from 1976 to 2016 of Ghana. No data until 1975. Number of actual observations by date: 41.
Source name:
World Development Indicators
Source organization:
International Monetary Fund, Balance of Payments Statistics Yearbook and data files.
Categories, topics:
Economy & Growth, Trade
Last updated:
apr 23, 2017
Indicators value changes by year
Minimum:
25.462
jan 1, 2016
Maximum:
60.587
jan 1, 1976
At the date of observation
Value
Absolute change
Change from previous value
jan 1, 1976
60.587
+60.587
0.0%
jan 1, 1977
58.089
-2.498
-4.12%
jan 1, 1978
49.707
-8.382
-14.43%
jan 1, 1979
57.88
+8.173
16.44%
jan 1, 1980
50.05
-7.829
-13.53%
jan 1, 1981
39.744
-10.306
-20.59%
jan 1, 1982
43.258
+3.513
8.84%
jan 1, 1983
40.39
-2.868
-6.63%
jan 1, 1984
47.431
+7.041
17.43%
jan 1, 1985
46.399
-1.033
-2.18%
jan 1, 1986
54.794
+8.396
18.09%
jan 1, 1987
41.038
-13.756
-25.1%
jan 1, 1988
43.949
+2.911
7.09%
jan 1, 1989
45.224
+1.275
2.9%
jan 1, 1990
41.138
-4.086
-9.03%
jan 1, 1991
41.398
+0.26
0.63%
jan 1, 1992
44.939
+3.541
8.55%
jan 1, 1993
46.908
+1.969
4.38%
jan 1, 1994
44.397
-2.511
-5.35%
jan 1, 1995
45.984
+1.587
3.57%
jan 1, 1996
47.009
+1.025
2.23%
jan 1, 1997
49.88
+2.871
6.11%
jan 1, 1998
49.051
-0.829
-1.66%
jan 1, 1999
45.698
-3.353
-6.84%
jan 1, 2000
49.16
+3.462
7.58%
jan 1, 2001
46.463
-2.697
-5.49%
jan 1, 2002
46.496
+0.033
0.07%
jan 1, 2003
43.239
-3.257
-7.0%
jan 1, 2004
35.041
-8.198
-18.96%
jan 1, 2005
37.151
+2.111
6.02%
jan 1, 2006
45.626
+8.475
22.81%
jan 1, 2007
48.253
+2.626
5.76%
jan 1, 2008
42.789
-5.463
-11.32%
jan 1, 2009
48.068
+5.278
12.34%
jan 1, 2010
30.388
-17.68
-36.78%
jan 1, 2011
37.802
+7.415
24.4%
jan 1, 2012
50.131
+12.329
32.61%
jan 1, 2013
45.317
-4.814
-9.6%
jan 1, 2014
38.569
-6.749
-14.89%
jan 1, 2015
34.72
-3.849
-9.98%
jan 1, 2016
25.462
-9.258
-26.67%
Ranking of countries by current statistics by years


Comments: