29
/
en
AIzaSyAYiBZKx7MnpbEhh9jyipgxe19OcubqV5w
April 1, 2024
30370
Euro area
EMU
false
2
1
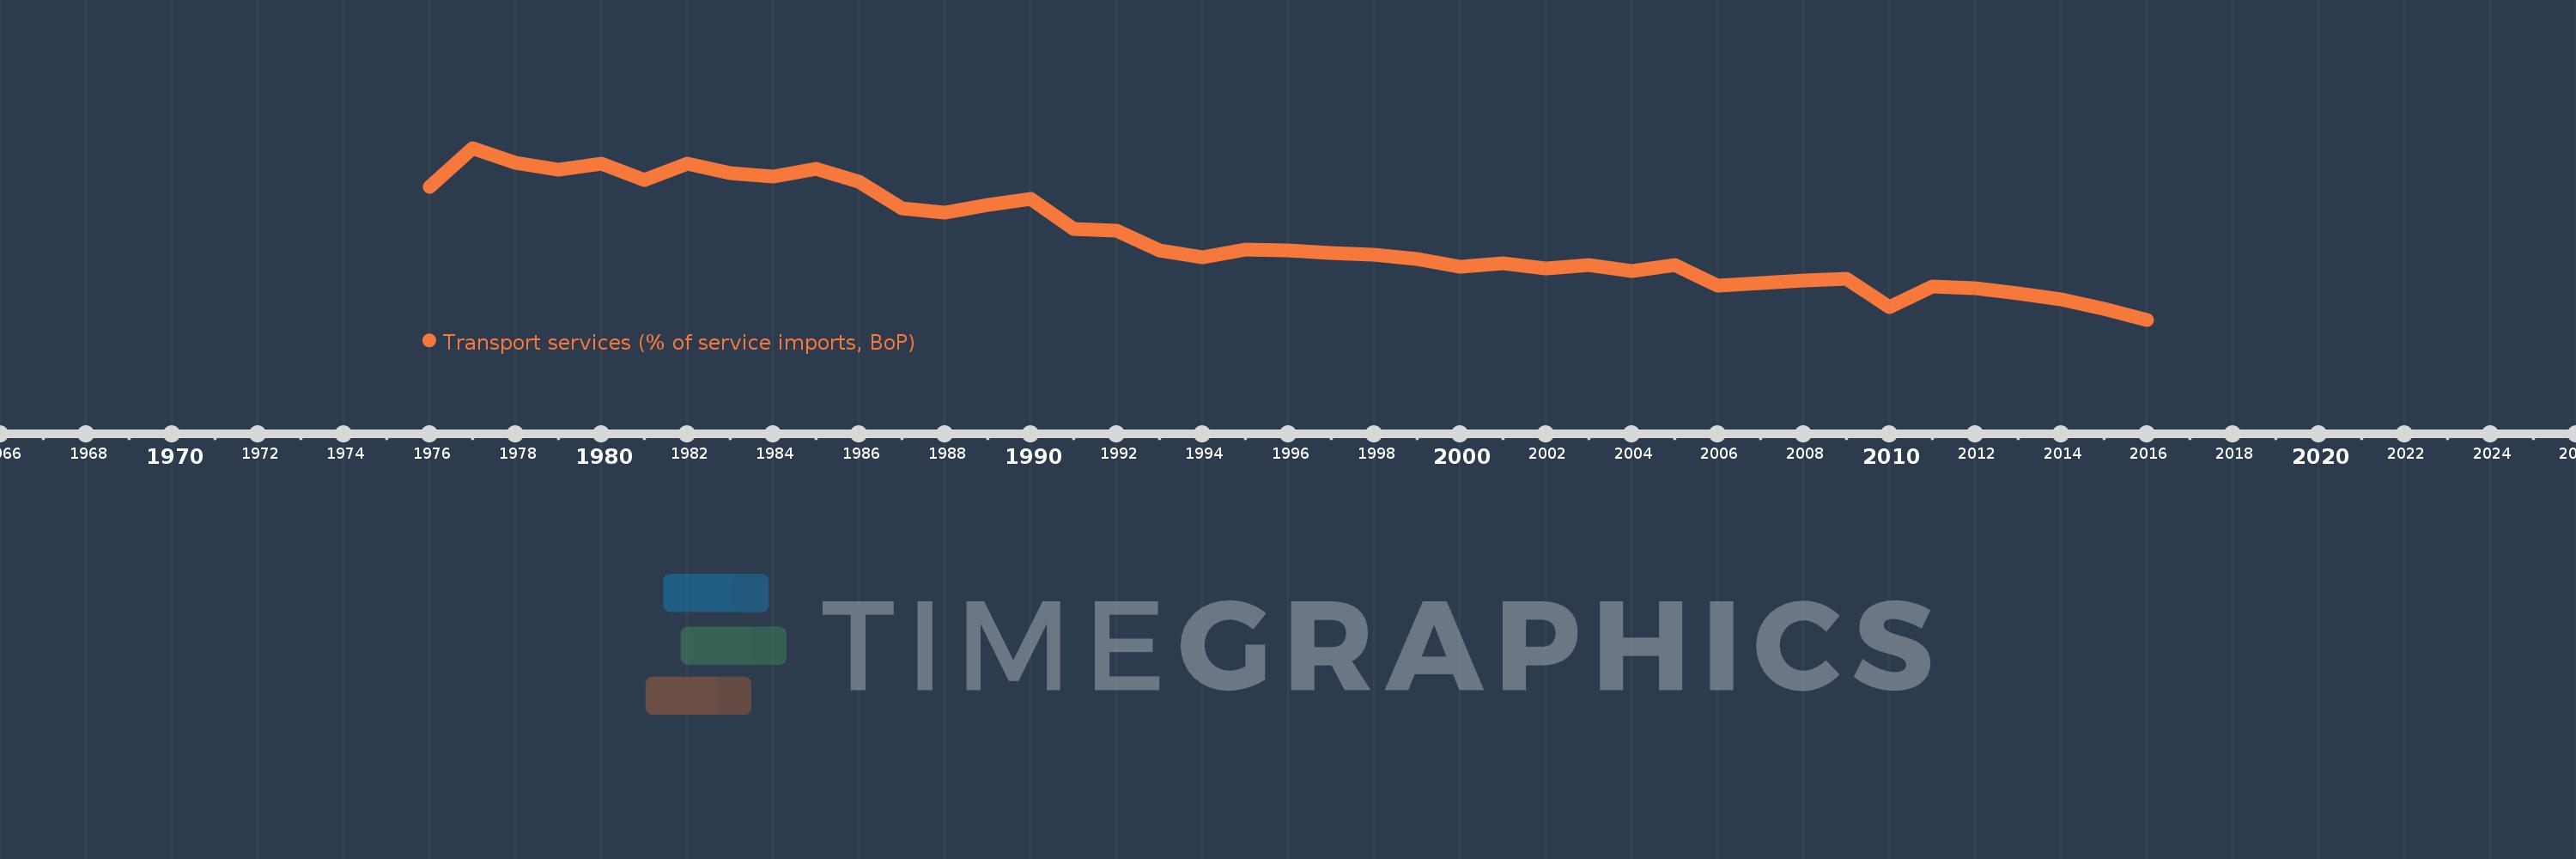
Transport services (% of service imports, BoP)
2016,2015,2014,2013,2012,2011,2010,2009,2008,2007,2006,2005,2004,2003,2002,2001,2000,1999,1998,1997,1996,1995,1994,1993,1992,1991,1990,1989,1988,1987,1986,1985,1984,1983,1982,1981,1980,1979,1978,1977,1976
This statistics in other country:
AfghanistanAlbaniaAlgeriaAngolaAntigua and BarbudaArab WorldArgentinaArmeniaArubaAustraliaAustriaAzerbaijanBahamas, TheBahrainBangladeshBarbadosBelarusBelgiumBelizeBeninBermudaBhutanBoliviaBosnia and HerzegovinaBotswanaBrazilBrunei DarussalamBulgariaBurkina FasoBurundiCabo VerdeCambodiaCameroonCanadaCaribbean small statesCentral African RepublicCentral Europe and the BalticsChadChileChinaColombiaComorosCongo, Dem. Rep.Congo, Rep.Costa RicaCote d'IvoireCroatiaCuracaoCyprusCzech RepublicDenmarkDjiboutiDominicaDominican RepublicEarly-demographic dividendEast Asia & PacificEast Asia & Pacific (excluding high income)East Asia & Pacific (IDA & IBRD countries)EcuadorEgypt, Arab Rep.El SalvadorEquatorial GuineaEritreaEstoniaEthiopiaEuro areaEurope & Central AsiaEurope & Central Asia (excluding high income)Europe & Central Asia (IDA & IBRD countries)European UnionFaroe IslandsFijiFinlandFragile and conflict affected situationsFranceFrench PolynesiaGabonGambia, TheGeorgiaGermanyGhanaGreeceGrenadaGuatemalaGuineaGuinea-BissauGuyanaHaitiHeavily indebted poor countries (HIPC)High incomeHondurasHong Kong SAR, ChinaHungaryIBRD onlyIcelandIDA & IBRD totalIDA onlyIDA totalIndiaIndonesiaIran, Islamic Rep.IraqIrelandIsraelItalyJamaicaJapanJordanKazakhstanKenyaKiribatiKorea, Rep.KosovoKuwaitKyrgyz RepublicLao PDRLate-demographic dividendLatin America & Caribbean Latin America & Caribbean (excluding high income)Latin America & the Caribbean (IDA & IBRD countries)LatviaLeast developed countries: UN classificationLebanonLesothoLiberiaLibyaLithuaniaLow & middle incomeLow incomeLower middle incomeLuxembourgMacao SAR, ChinaMacedonia, FYRMadagascarMalawiMalaysiaMaldivesMaliMaltaMarshall IslandsMauritaniaMauritiusMexicoMicronesia, Fed. Sts.Middle East & North AfricaMiddle East & North Africa (excluding high income)Middle East & North Africa (IDA & IBRD countries)Middle incomeMoldovaMongoliaMontenegroMoroccoMozambiqueMyanmarNamibiaNepalNetherlandsNew CaledoniaNew ZealandNicaraguaNigerNigeriaNorth AmericaNorwayOECD membersOmanOther small statesPacific island small statesPakistanPalauPanamaPapua New GuineaParaguayPeruPhilippinesPolandPortugalPost-demographic dividendPre-demographic dividendQatarRomaniaRussian FederationRwandaSamoaSao Tome and PrincipeSaudi ArabiaSenegalSerbiaSeychellesSierra LeoneSingaporeSint Maarten (Dutch part)Slovak RepublicSloveniaSmall statesSolomon IslandsSouth AfricaSouth AsiaSouth Asia (IDA & IBRD)South SudanSpainSri LankaSt. Kitts and NevisSt. LuciaSt. Vincent and the GrenadinesSub-Saharan Africa Sub-Saharan Africa (excluding high income)Sub-Saharan Africa (IDA & IBRD countries)SudanSurinameSwazilandSwedenSwitzerlandSyrian Arab RepublicTajikistanTanzaniaThailandTimor-LesteTogoTongaTrinidad and TobagoTunisiaTurkeyTuvaluUgandaUkraineUnited KingdomUnited StatesUpper middle incomeUruguayVanuatuVenezuela, RBWest Bank and GazaWorldYemen, Rep.ZambiaZimbabwe Timeline:
This timeline shows a graph from 1976 to 2016 of Euro area. No data until 1975. Number of actual observations by date: 41.
Source name:
World Development Indicators
Source organization:
International Monetary Fund, Balance of Payments Statistics Yearbook and data files.
Categories, topics:
Economy & Growth, Trade
Last updated:
apr 23, 2017
Indicators value changes by year
Maximum:
34.784
jan 1, 1977
At the date of observation
Value
Absolute change
Change from previous value
jan 1, 1976
30.906
+30.906
0.0%
jan 1, 1977
34.784
+3.879
12.55%
jan 1, 1978
33.285
-1.499
-4.31%
jan 1, 1979
32.633
-0.652
-1.96%
jan 1, 1980
33.207
+0.573
1.76%
jan 1, 1981
31.658
-1.549
-4.66%
jan 1, 1982
33.218
+1.56
4.93%
jan 1, 1983
32.33
-0.888
-2.67%
jan 1, 1984
31.975
-0.355
-1.1%
jan 1, 1985
32.689
+0.714
2.23%
jan 1, 1986
31.467
-1.222
-3.74%
jan 1, 1987
28.823
-2.644
-8.4%
jan 1, 1988
28.44
-0.383
-1.33%
jan 1, 1989
29.128
+0.688
2.42%
jan 1, 1990
29.784
+0.656
2.25%
jan 1, 1991
26.791
-2.993
-10.05%
jan 1, 1992
26.588
-0.203
-0.76%
jan 1, 1993
24.637
-1.952
-7.34%
jan 1, 1994
23.994
-0.643
-2.61%
jan 1, 1995
24.75
+0.756
3.15%
jan 1, 1996
24.665
-0.085
-0.34%
jan 1, 1997
24.395
-0.27
-1.1%
jan 1, 1998
24.265
-0.13
-0.53%
jan 1, 1999
23.851
-0.414
-1.7%
jan 1, 2000
23.109
-0.742
-3.11%
jan 1, 2001
23.412
+0.302
1.31%
jan 1, 2002
22.904
-0.507
-2.17%
jan 1, 2003
23.251
+0.347
1.52%
jan 1, 2004
22.683
-0.568
-2.44%
jan 1, 2005
23.228
+0.545
2.4%
jan 1, 2006
21.244
-1.984
-8.54%
jan 1, 2007
21.457
+0.213
1.0%
jan 1, 2008
21.72
+0.263
1.22%
jan 1, 2009
21.917
+0.198
0.91%
jan 1, 2010
19.124
-2.793
-12.75%
jan 1, 2011
21.104
+1.98
10.35%
jan 1, 2012
20.932
-0.172
-0.81%
jan 1, 2013
20.468
-0.464
-2.22%
jan 1, 2014
19.877
-0.591
-2.89%
jan 1, 2015
18.891
-0.986
-4.96%
jan 1, 2016
17.84
-1.051
-5.57%
Ranking of countries by current statistics by years


Comments: