29
/
en
AIzaSyAYiBZKx7MnpbEhh9jyipgxe19OcubqV5w
April 1, 2024
28795
East Asia & Pacific (excluding high income)
EAP
false
2
1
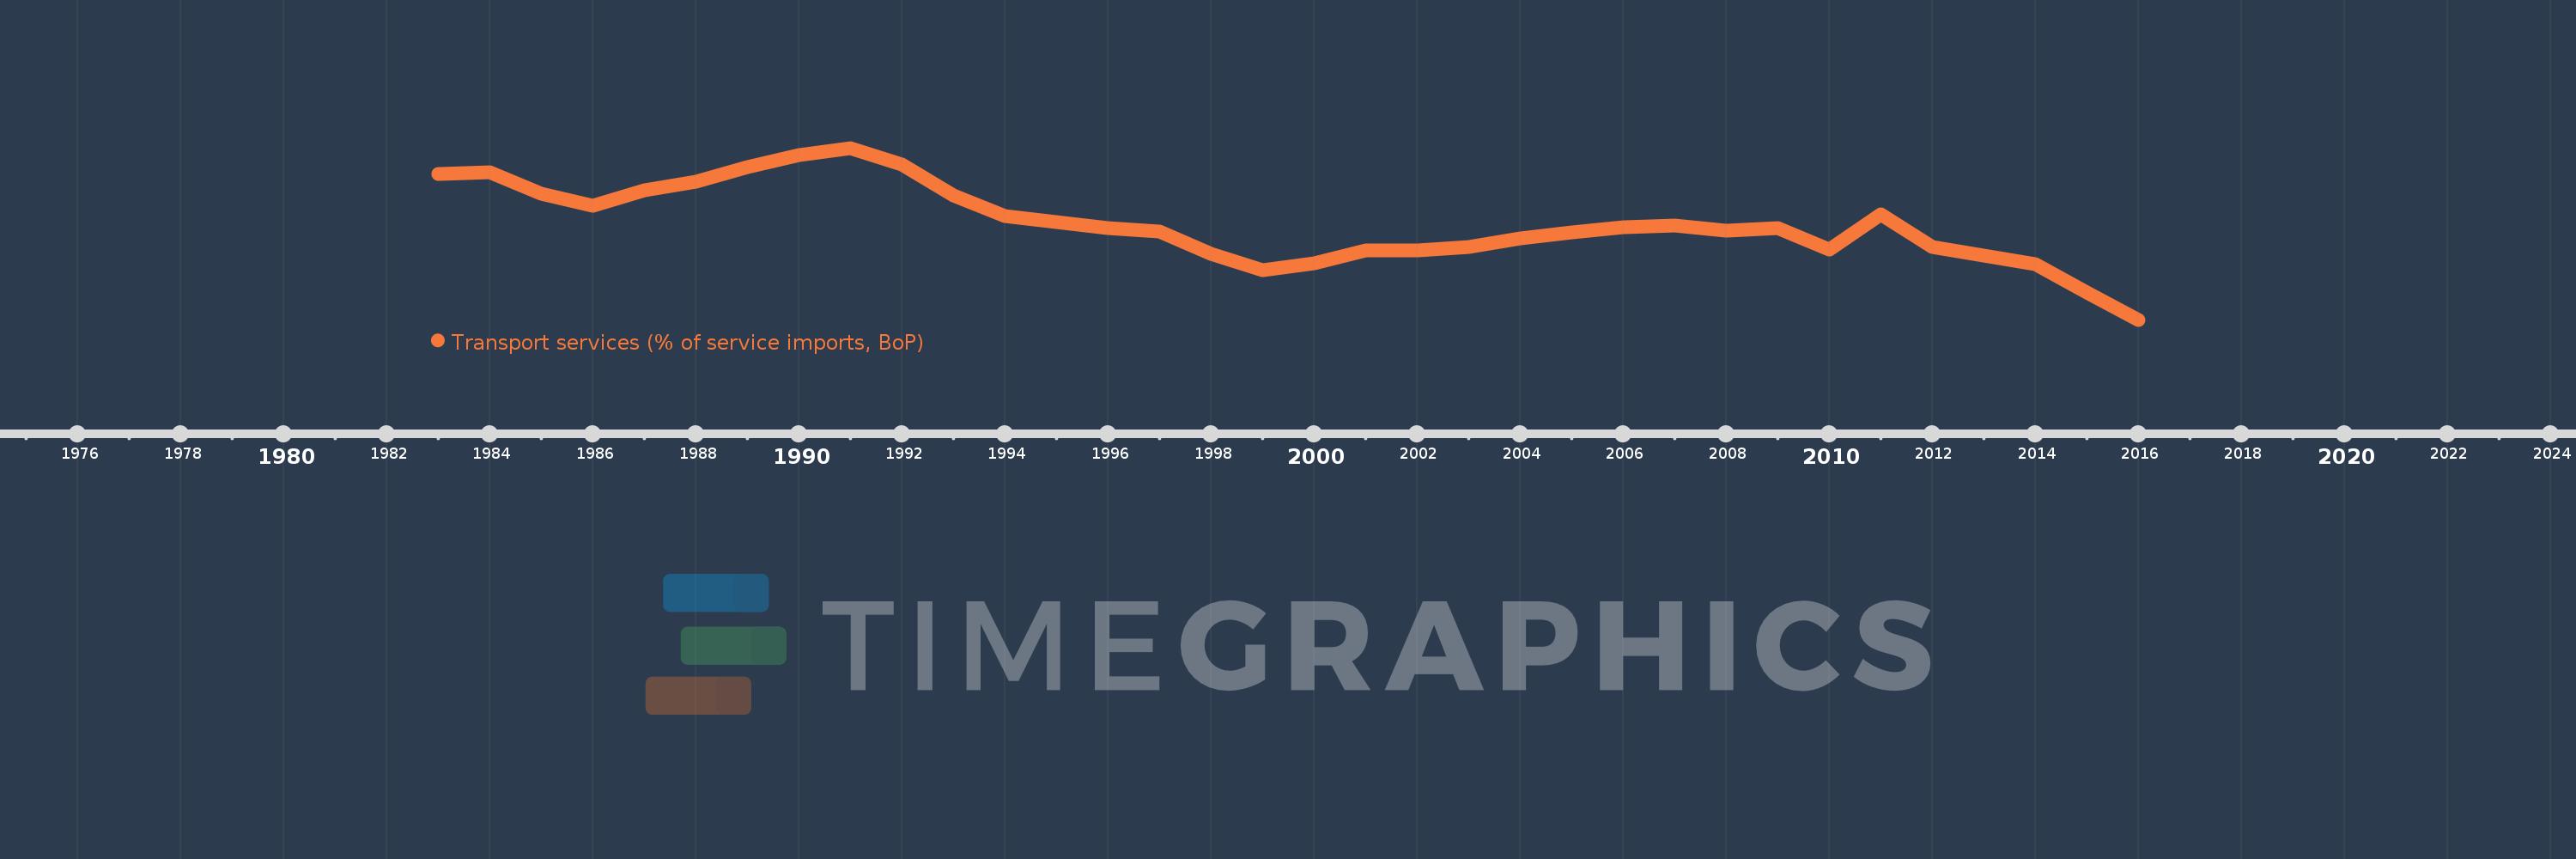
Transport services (% of service imports, BoP)
2016,2015,2014,2013,2012,2011,2010,2009,2008,2007,2006,2005,2004,2003,2002,2001,2000,1999,1998,1997,1996,1995,1994,1993,1992,1991,1990,1989,1988,1987,1986,1985,1984,1983
This statistics in other country:
AfghanistanAlbaniaAlgeriaAngolaAntigua and BarbudaArab WorldArgentinaArmeniaArubaAustraliaAustriaAzerbaijanBahamas, TheBahrainBangladeshBarbadosBelarusBelgiumBelizeBeninBermudaBhutanBoliviaBosnia and HerzegovinaBotswanaBrazilBrunei DarussalamBulgariaBurkina FasoBurundiCabo VerdeCambodiaCameroonCanadaCaribbean small statesCentral African RepublicCentral Europe and the BalticsChadChileChinaColombiaComorosCongo, Dem. Rep.Congo, Rep.Costa RicaCote d'IvoireCroatiaCuracaoCyprusCzech RepublicDenmarkDjiboutiDominicaDominican RepublicEarly-demographic dividendEast Asia & PacificEast Asia & Pacific (excluding high income)East Asia & Pacific (IDA & IBRD countries)EcuadorEgypt, Arab Rep.El SalvadorEquatorial GuineaEritreaEstoniaEthiopiaEuro areaEurope & Central AsiaEurope & Central Asia (excluding high income)Europe & Central Asia (IDA & IBRD countries)European UnionFaroe IslandsFijiFinlandFragile and conflict affected situationsFranceFrench PolynesiaGabonGambia, TheGeorgiaGermanyGhanaGreeceGrenadaGuatemalaGuineaGuinea-BissauGuyanaHaitiHeavily indebted poor countries (HIPC)High incomeHondurasHong Kong SAR, ChinaHungaryIBRD onlyIcelandIDA & IBRD totalIDA onlyIDA totalIndiaIndonesiaIran, Islamic Rep.IraqIrelandIsraelItalyJamaicaJapanJordanKazakhstanKenyaKiribatiKorea, Rep.KosovoKuwaitKyrgyz RepublicLao PDRLate-demographic dividendLatin America & Caribbean Latin America & Caribbean (excluding high income)Latin America & the Caribbean (IDA & IBRD countries)LatviaLeast developed countries: UN classificationLebanonLesothoLiberiaLibyaLithuaniaLow & middle incomeLow incomeLower middle incomeLuxembourgMacao SAR, ChinaMacedonia, FYRMadagascarMalawiMalaysiaMaldivesMaliMaltaMarshall IslandsMauritaniaMauritiusMexicoMicronesia, Fed. Sts.Middle East & North AfricaMiddle East & North Africa (excluding high income)Middle East & North Africa (IDA & IBRD countries)Middle incomeMoldovaMongoliaMontenegroMoroccoMozambiqueMyanmarNamibiaNepalNetherlandsNew CaledoniaNew ZealandNicaraguaNigerNigeriaNorth AmericaNorwayOECD membersOmanOther small statesPacific island small statesPakistanPalauPanamaPapua New GuineaParaguayPeruPhilippinesPolandPortugalPost-demographic dividendPre-demographic dividendQatarRomaniaRussian FederationRwandaSamoaSao Tome and PrincipeSaudi ArabiaSenegalSerbiaSeychellesSierra LeoneSingaporeSint Maarten (Dutch part)Slovak RepublicSloveniaSmall statesSolomon IslandsSouth AfricaSouth AsiaSouth Asia (IDA & IBRD)South SudanSpainSri LankaSt. Kitts and NevisSt. LuciaSt. Vincent and the GrenadinesSub-Saharan Africa Sub-Saharan Africa (excluding high income)Sub-Saharan Africa (IDA & IBRD countries)SudanSurinameSwazilandSwedenSwitzerlandSyrian Arab RepublicTajikistanTanzaniaThailandTimor-LesteTogoTongaTrinidad and TobagoTunisiaTurkeyTuvaluUgandaUkraineUnited KingdomUnited StatesUpper middle incomeUruguayVanuatuVenezuela, RBWest Bank and GazaWorldYemen, Rep.ZambiaZimbabwe Timeline:
This timeline shows a graph from 1983 to 2016 of East Asia & Pacific (excluding high income). No data until 1982. Number of actual observations by date: 34.
Source name:
World Development Indicators
Source organization:
International Monetary Fund, Balance of Payments Statistics Yearbook and data files.
Categories, topics:
Economy & Growth, Trade
Last updated:
apr 23, 2017
Indicators value changes by year
Minimum:
18.256
jan 1, 2016
Maximum:
54.328
jan 1, 1991
At the date of observation
Value
Absolute change
Change from previous value
jan 1, 1983
48.927
+48.927
0.0%
jan 1, 1984
49.305
+0.378
0.77%
jan 1, 1985
44.676
-4.629
-9.39%
jan 1, 1986
42.211
-2.465
-5.52%
jan 1, 1987
45.472
+3.261
7.72%
jan 1, 1988
47.177
+1.705
3.75%
jan 1, 1989
50.335
+3.158
6.69%
jan 1, 1990
52.855
+2.521
5.01%
jan 1, 1991
54.328
+1.472
2.79%
jan 1, 1992
50.791
-3.536
-6.51%
jan 1, 1993
44.282
-6.509
-12.82%
jan 1, 1994
40.059
-4.223
-9.54%
jan 1, 1995
38.7
-1.359
-3.39%
jan 1, 1996
37.422
-1.279
-3.3%
jan 1, 1997
36.797
-0.625
-1.67%
jan 1, 1998
32.161
-4.636
-12.6%
jan 1, 1999
28.592
-3.569
-11.1%
jan 1, 2000
30.122
+1.53
5.35%
jan 1, 2001
32.866
+2.744
9.11%
jan 1, 2002
32.746
-0.12
-0.37%
jan 1, 2003
33.452
+0.706
2.16%
jan 1, 2004
35.424
+1.972
5.9%
jan 1, 2005
36.545
+1.121
3.16%
jan 1, 2006
37.761
+1.216
3.33%
jan 1, 2007
38.084
+0.323
0.86%
jan 1, 2008
36.948
-1.136
-2.98%
jan 1, 2009
37.439
+0.491
1.33%
jan 1, 2010
33.014
-4.425
-11.82%
jan 1, 2011
40.316
+7.301
22.12%
jan 1, 2012
33.536
-6.779
-16.82%
jan 1, 2013
31.734
-1.802
-5.37%
jan 1, 2014
29.887
-1.847
-5.82%
jan 1, 2015
23.919
-5.968
-19.97%
jan 1, 2016
18.256
-5.664
-23.68%
Ranking of countries by current statistics by years


Comments: