29
/
en
AIzaSyAYiBZKx7MnpbEhh9jyipgxe19OcubqV5w
April 1, 2024
151226
Honduras
HND
true
2
1
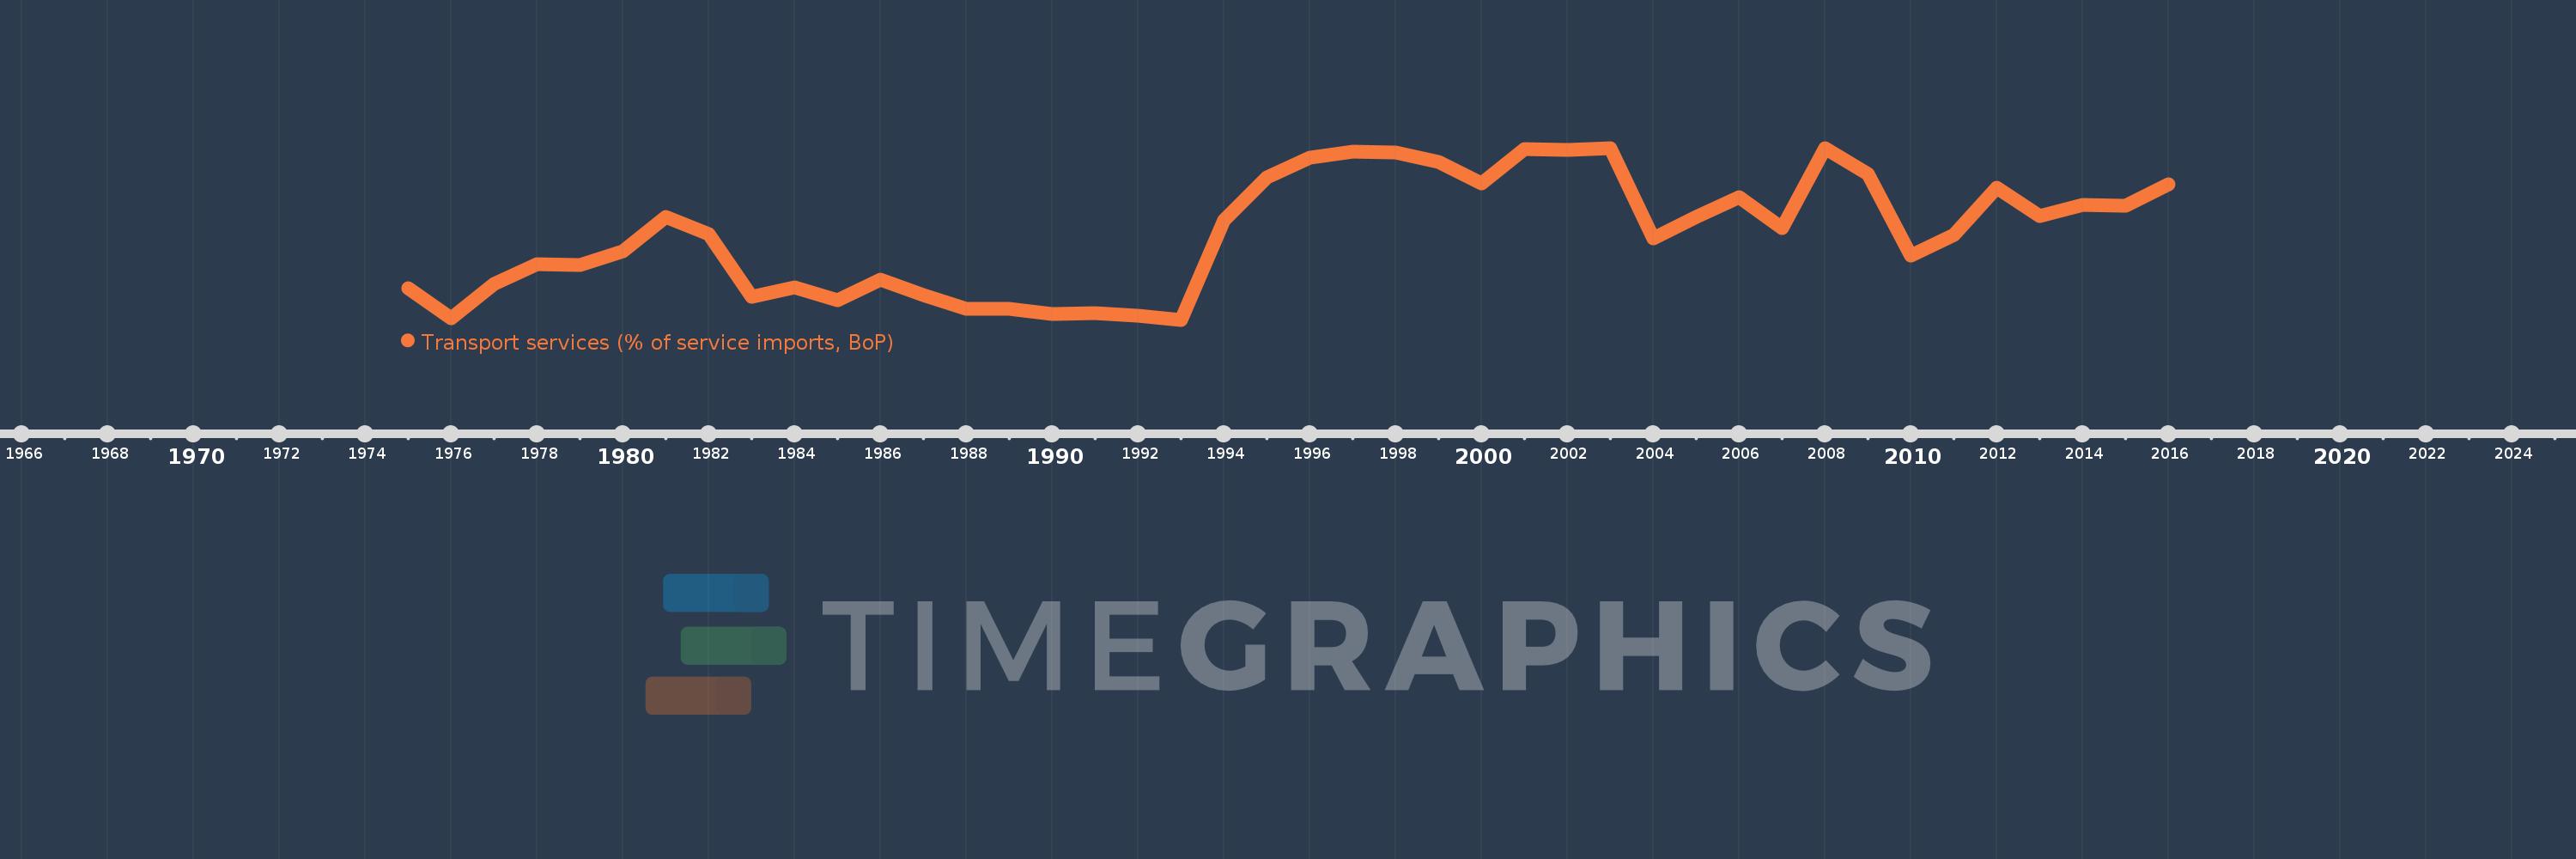
Transport services (% of service imports, BoP)
2016,2015,2014,2013,2012,2011,2010,2009,2008,2007,2006,2005,2004,2003,2002,2001,2000,1999,1998,1997,1996,1995,1994,1993,1992,1991,1990,1989,1988,1987,1986,1985,1984,1983,1982,1981,1980,1979,1978,1977,1976,1975
This statistics in other country:
AfghanistanAlbaniaAlgeriaAngolaAntigua and BarbudaArab WorldArgentinaArmeniaArubaAustraliaAustriaAzerbaijanBahamas, TheBahrainBangladeshBarbadosBelarusBelgiumBelizeBeninBermudaBhutanBoliviaBosnia and HerzegovinaBotswanaBrazilBrunei DarussalamBulgariaBurkina FasoBurundiCabo VerdeCambodiaCameroonCanadaCaribbean small statesCentral African RepublicCentral Europe and the BalticsChadChileChinaColombiaComorosCongo, Dem. Rep.Congo, Rep.Costa RicaCote d'IvoireCroatiaCuracaoCyprusCzech RepublicDenmarkDjiboutiDominicaDominican RepublicEarly-demographic dividendEast Asia & PacificEast Asia & Pacific (excluding high income)East Asia & Pacific (IDA & IBRD countries)EcuadorEgypt, Arab Rep.El SalvadorEquatorial GuineaEritreaEstoniaEthiopiaEuro areaEurope & Central AsiaEurope & Central Asia (excluding high income)Europe & Central Asia (IDA & IBRD countries)European UnionFaroe IslandsFijiFinlandFragile and conflict affected situationsFranceFrench PolynesiaGabonGambia, TheGeorgiaGermanyGhanaGreeceGrenadaGuatemalaGuineaGuinea-BissauGuyanaHaitiHeavily indebted poor countries (HIPC)High incomeHondurasHong Kong SAR, ChinaHungaryIBRD onlyIcelandIDA & IBRD totalIDA onlyIDA totalIndiaIndonesiaIran, Islamic Rep.IraqIrelandIsraelItalyJamaicaJapanJordanKazakhstanKenyaKiribatiKorea, Rep.KosovoKuwaitKyrgyz RepublicLao PDRLate-demographic dividendLatin America & Caribbean Latin America & Caribbean (excluding high income)Latin America & the Caribbean (IDA & IBRD countries)LatviaLeast developed countries: UN classificationLebanonLesothoLiberiaLibyaLithuaniaLow & middle incomeLow incomeLower middle incomeLuxembourgMacao SAR, ChinaMacedonia, FYRMadagascarMalawiMalaysiaMaldivesMaliMaltaMarshall IslandsMauritaniaMauritiusMexicoMicronesia, Fed. Sts.Middle East & North AfricaMiddle East & North Africa (excluding high income)Middle East & North Africa (IDA & IBRD countries)Middle incomeMoldovaMongoliaMontenegroMoroccoMozambiqueMyanmarNamibiaNepalNetherlandsNew CaledoniaNew ZealandNicaraguaNigerNigeriaNorth AmericaNorwayOECD membersOmanOther small statesPacific island small statesPakistanPalauPanamaPapua New GuineaParaguayPeruPhilippinesPolandPortugalPost-demographic dividendPre-demographic dividendQatarRomaniaRussian FederationRwandaSamoaSao Tome and PrincipeSaudi ArabiaSenegalSerbiaSeychellesSierra LeoneSingaporeSint Maarten (Dutch part)Slovak RepublicSloveniaSmall statesSolomon IslandsSouth AfricaSouth AsiaSouth Asia (IDA & IBRD)South SudanSpainSri LankaSt. Kitts and NevisSt. LuciaSt. Vincent and the GrenadinesSub-Saharan Africa Sub-Saharan Africa (excluding high income)Sub-Saharan Africa (IDA & IBRD countries)SudanSurinameSwazilandSwedenSwitzerlandSyrian Arab RepublicTajikistanTanzaniaThailandTimor-LesteTogoTongaTrinidad and TobagoTunisiaTurkeyTuvaluUgandaUkraineUnited KingdomUnited StatesUpper middle incomeUruguayVanuatuVenezuela, RBWest Bank and GazaWorldYemen, Rep.ZambiaZimbabwe Timeline:
This timeline shows a graph from 1975 to 2016 of Honduras. No data until 1974. Number of actual observations by date: 42.
Source name:
World Development Indicators
Source organization:
International Monetary Fund, Balance of Payments Statistics Yearbook and data files.
Categories, topics:
Economy & Growth, Trade
Last updated:
apr 23, 2017
Indicators value changes by year
Minimum:
43.339
jan 1, 1993
Maximum:
59.869
jan 1, 2008
At the date of observation
Value
Absolute change
Change from previous value
jan 1, 1975
46.34
+46.34
0.0%
jan 1, 1976
43.458
-2.882
-6.22%
jan 1, 1977
46.805
+3.347
7.7%
jan 1, 1978
48.672
+1.867
3.99%
jan 1, 1979
48.578
-0.093
-0.19%
jan 1, 1980
49.966
+1.388
2.86%
jan 1, 1981
53.262
+3.296
6.6%
jan 1, 1982
51.573
-1.689
-3.17%
jan 1, 1983
45.581
-5.993
-11.62%
jan 1, 1984
46.448
+0.867
1.9%
jan 1, 1985
45.182
-1.266
-2.73%
jan 1, 1986
47.209
+2.028
4.49%
jan 1, 1987
45.695
-1.515
-3.21%
jan 1, 1988
44.376
-1.319
-2.89%
jan 1, 1989
44.414
+0.038
0.09%
jan 1, 1990
43.905
-0.509
-1.15%
jan 1, 1991
43.995
+0.09
0.2%
jan 1, 1992
43.714
-0.28
-0.64%
jan 1, 1993
43.339
-0.375
-0.86%
jan 1, 1994
52.935
+9.596
22.14%
jan 1, 1995
57.01
+4.074
7.7%
jan 1, 1996
58.945
+1.936
3.4%
jan 1, 1997
59.545
+0.6
1.02%
jan 1, 1998
59.427
-0.118
-0.2%
jan 1, 1999
58.55
-0.877
-1.48%
jan 1, 2000
56.469
-2.081
-3.55%
jan 1, 2001
59.738
+3.27
5.79%
jan 1, 2002
59.692
-0.047
-0.08%
jan 1, 2003
59.835
+0.143
0.24%
jan 1, 2004
51.149
-8.686
-14.52%
jan 1, 2005
53.191
+2.042
3.99%
jan 1, 2006
55.167
+1.976
3.71%
jan 1, 2007
52.159
-3.008
-5.45%
jan 1, 2008
59.869
+7.71
14.78%
jan 1, 2009
57.35
-2.518
-4.21%
jan 1, 2010
49.546
-7.804
-13.61%
jan 1, 2011
51.496
+1.95
3.94%
jan 1, 2012
56.069
+4.573
8.88%
jan 1, 2013
53.31
-2.759
-4.92%
jan 1, 2014
54.387
+1.078
2.02%
jan 1, 2015
54.308
-0.08
-0.15%
jan 1, 2016
56.345
+2.038
3.75%
Ranking of countries by current statistics by years


Comments: