29
/
en
AIzaSyAYiBZKx7MnpbEhh9jyipgxe19OcubqV5w
April 1, 2024
252577
St. Vincent and the Grenadines
VCT
true
2
1
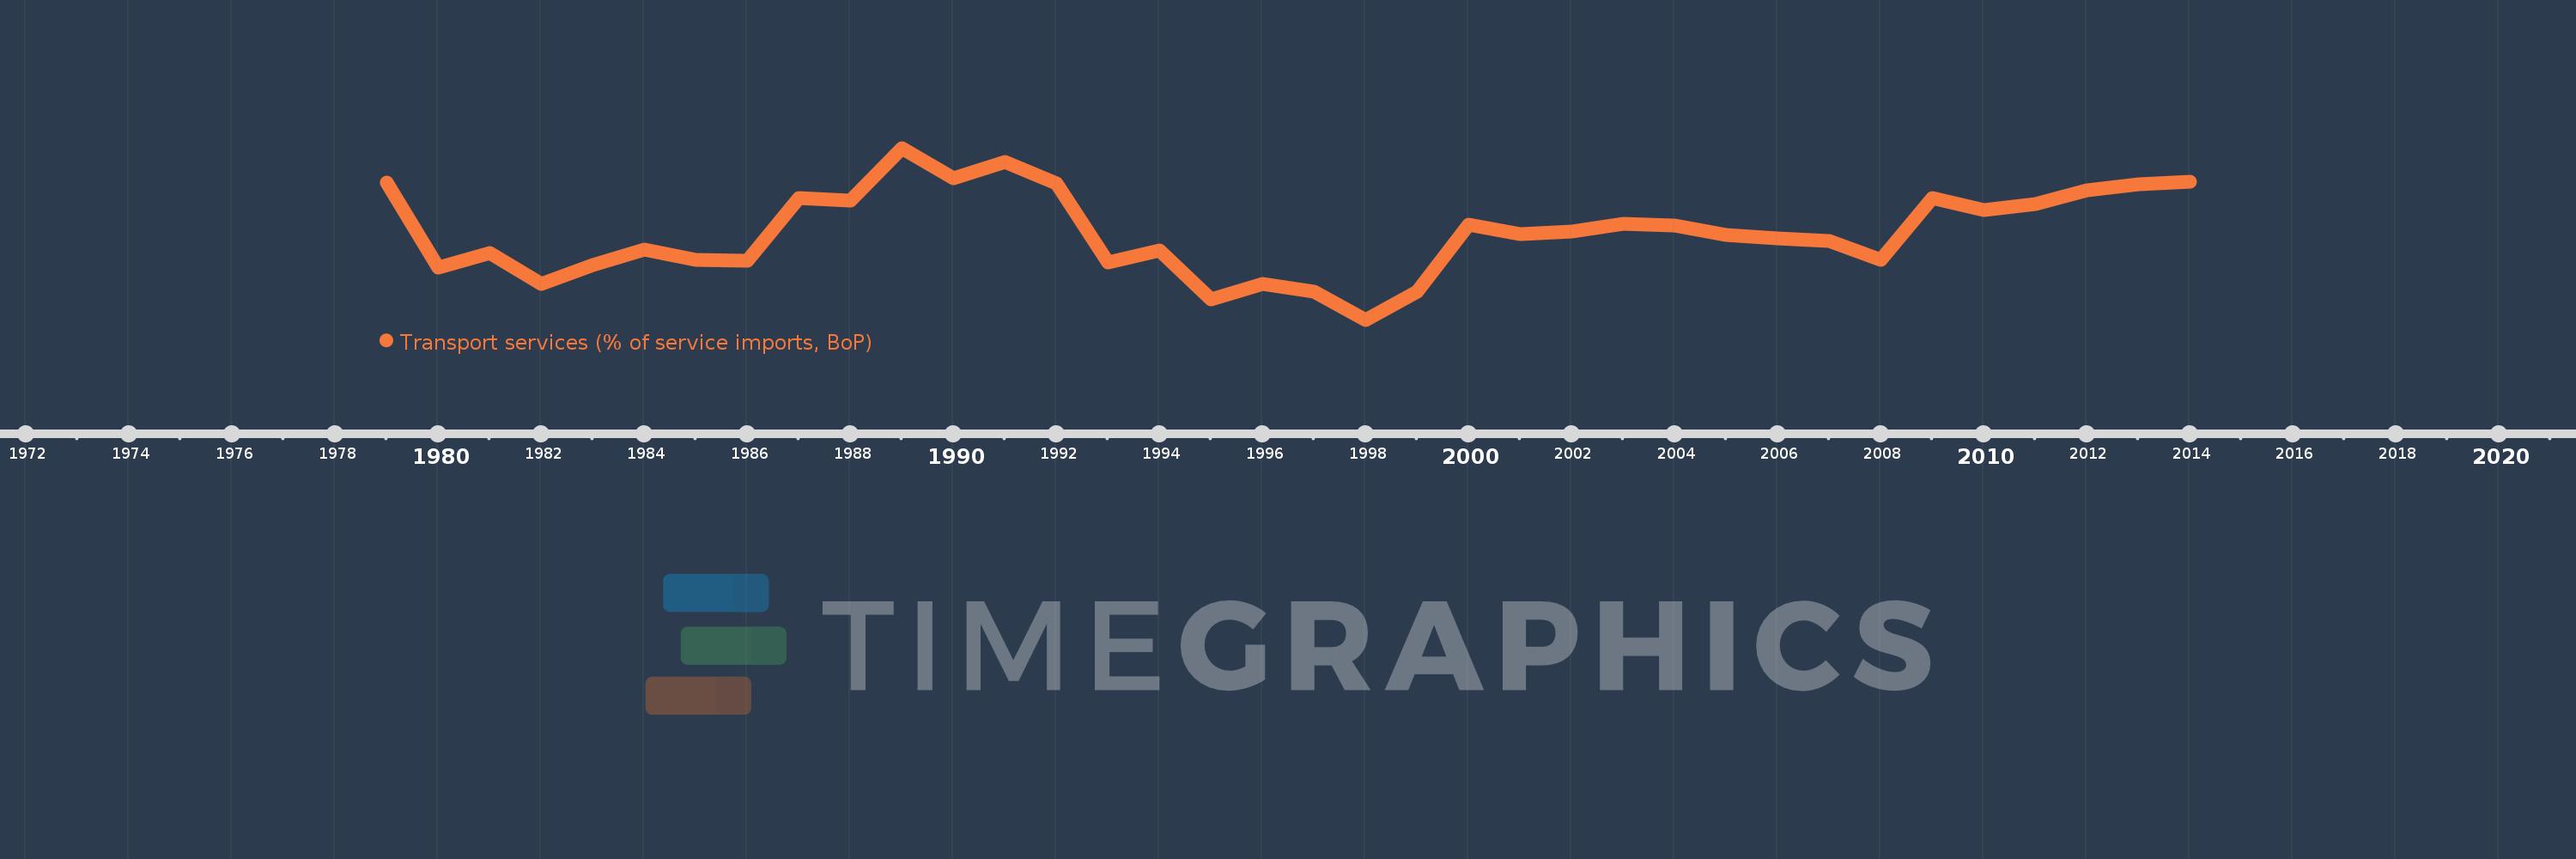
Transport services (% of service imports, BoP)
2014,2013,2012,2011,2010,2009,2008,2007,2006,2005,2004,2003,2002,2001,2000,1999,1998,1997,1996,1995,1994,1993,1992,1991,1990,1989,1988,1987,1986,1985,1984,1983,1982,1981,1980,1979
This statistics in other country:
AfghanistanAlbaniaAlgeriaAngolaAntigua and BarbudaArab WorldArgentinaArmeniaArubaAustraliaAustriaAzerbaijanBahamas, TheBahrainBangladeshBarbadosBelarusBelgiumBelizeBeninBermudaBhutanBoliviaBosnia and HerzegovinaBotswanaBrazilBrunei DarussalamBulgariaBurkina FasoBurundiCabo VerdeCambodiaCameroonCanadaCaribbean small statesCentral African RepublicCentral Europe and the BalticsChadChileChinaColombiaComorosCongo, Dem. Rep.Congo, Rep.Costa RicaCote d'IvoireCroatiaCuracaoCyprusCzech RepublicDenmarkDjiboutiDominicaDominican RepublicEarly-demographic dividendEast Asia & PacificEast Asia & Pacific (excluding high income)East Asia & Pacific (IDA & IBRD countries)EcuadorEgypt, Arab Rep.El SalvadorEquatorial GuineaEritreaEstoniaEthiopiaEuro areaEurope & Central AsiaEurope & Central Asia (excluding high income)Europe & Central Asia (IDA & IBRD countries)European UnionFaroe IslandsFijiFinlandFragile and conflict affected situationsFranceFrench PolynesiaGabonGambia, TheGeorgiaGermanyGhanaGreeceGrenadaGuatemalaGuineaGuinea-BissauGuyanaHaitiHeavily indebted poor countries (HIPC)High incomeHondurasHong Kong SAR, ChinaHungaryIBRD onlyIcelandIDA & IBRD totalIDA onlyIDA totalIndiaIndonesiaIran, Islamic Rep.IraqIrelandIsraelItalyJamaicaJapanJordanKazakhstanKenyaKiribatiKorea, Rep.KosovoKuwaitKyrgyz RepublicLao PDRLate-demographic dividendLatin America & Caribbean Latin America & Caribbean (excluding high income)Latin America & the Caribbean (IDA & IBRD countries)LatviaLeast developed countries: UN classificationLebanonLesothoLiberiaLibyaLithuaniaLow & middle incomeLow incomeLower middle incomeLuxembourgMacao SAR, ChinaMacedonia, FYRMadagascarMalawiMalaysiaMaldivesMaliMaltaMarshall IslandsMauritaniaMauritiusMexicoMicronesia, Fed. Sts.Middle East & North AfricaMiddle East & North Africa (excluding high income)Middle East & North Africa (IDA & IBRD countries)Middle incomeMoldovaMongoliaMontenegroMoroccoMozambiqueMyanmarNamibiaNepalNetherlandsNew CaledoniaNew ZealandNicaraguaNigerNigeriaNorth AmericaNorwayOECD membersOmanOther small statesPacific island small statesPakistanPalauPanamaPapua New GuineaParaguayPeruPhilippinesPolandPortugalPost-demographic dividendPre-demographic dividendQatarRomaniaRussian FederationRwandaSamoaSao Tome and PrincipeSaudi ArabiaSenegalSerbiaSeychellesSierra LeoneSingaporeSint Maarten (Dutch part)Slovak RepublicSloveniaSmall statesSolomon IslandsSouth AfricaSouth AsiaSouth Asia (IDA & IBRD)South SudanSpainSri LankaSt. Kitts and NevisSt. LuciaSt. Vincent and the GrenadinesSub-Saharan Africa Sub-Saharan Africa (excluding high income)Sub-Saharan Africa (IDA & IBRD countries)SudanSurinameSwazilandSwedenSwitzerlandSyrian Arab RepublicTajikistanTanzaniaThailandTimor-LesteTogoTongaTrinidad and TobagoTunisiaTurkeyTuvaluUgandaUkraineUnited KingdomUnited StatesUpper middle incomeUruguayVanuatuVenezuela, RBWest Bank and GazaWorldYemen, Rep.ZambiaZimbabwe Timeline:
This timeline shows a graph from 1979 to 2014 of St. Vincent and the Grenadines. No data until 1978. Number of actual observations by date: 36.
Source name:
World Development Indicators
Source organization:
International Monetary Fund, Balance of Payments Statistics Yearbook and data files.
Categories, topics:
Economy & Growth, Trade
Last updated:
apr 23, 2017
Indicators value changes by year
Minimum:
29.709
jan 1, 1998
Maximum:
58.861
jan 1, 1989
At the date of observation
Value
Absolute change
Change from previous value
jan 1, 1979
52.962
+52.962
0.0%
jan 1, 1980
38.61
-14.352
-27.1%
jan 1, 1981
41.005
+2.395
6.2%
jan 1, 1982
35.819
-5.185
-12.65%
jan 1, 1983
39.038
+3.218
8.98%
jan 1, 1984
41.577
+2.539
6.51%
jan 1, 1985
39.94
-1.637
-3.94%
jan 1, 1986
39.773
-0.167
-0.42%
jan 1, 1987
50.404
+10.632
26.73%
jan 1, 1988
49.906
-0.499
-0.99%
jan 1, 1989
58.861
+8.956
17.95%
jan 1, 1990
53.644
-5.218
-8.86%
jan 1, 1991
56.464
+2.82
5.26%
jan 1, 1992
52.811
-3.652
-6.47%
jan 1, 1993
39.369
-13.443
-25.45%
jan 1, 1994
41.404
+2.035
5.17%
jan 1, 1995
33.121
-8.283
-20.0%
jan 1, 1996
35.792
+2.671
8.06%
jan 1, 1997
34.531
-1.26
-3.52%
jan 1, 1998
29.709
-4.823
-13.97%
jan 1, 1999
34.472
+4.763
16.03%
jan 1, 2000
45.797
+11.325
32.85%
jan 1, 2001
44.294
-1.503
-3.28%
jan 1, 2002
44.665
+0.371
0.84%
jan 1, 2003
46.005
+1.34
3.0%
jan 1, 2004
45.7
-0.304
-0.66%
jan 1, 2005
44.057
-1.643
-3.59%
jan 1, 2006
43.456
-0.601
-1.36%
jan 1, 2007
43.017
-0.44
-1.01%
jan 1, 2008
39.891
-3.126
-7.27%
jan 1, 2009
50.329
+10.439
26.17%
jan 1, 2010
48.329
-2.001
-3.98%
jan 1, 2011
49.33
+1.002
2.07%
jan 1, 2012
51.684
+2.353
4.77%
jan 1, 2013
52.765
+1.081
2.09%
jan 1, 2014
53.092
+0.327
0.62%
Ranking of countries by current statistics by years


Comments: