29
/
en
AIzaSyAYiBZKx7MnpbEhh9jyipgxe19OcubqV5w
April 1, 2024
178399
Lesotho
LSO
true
2
1
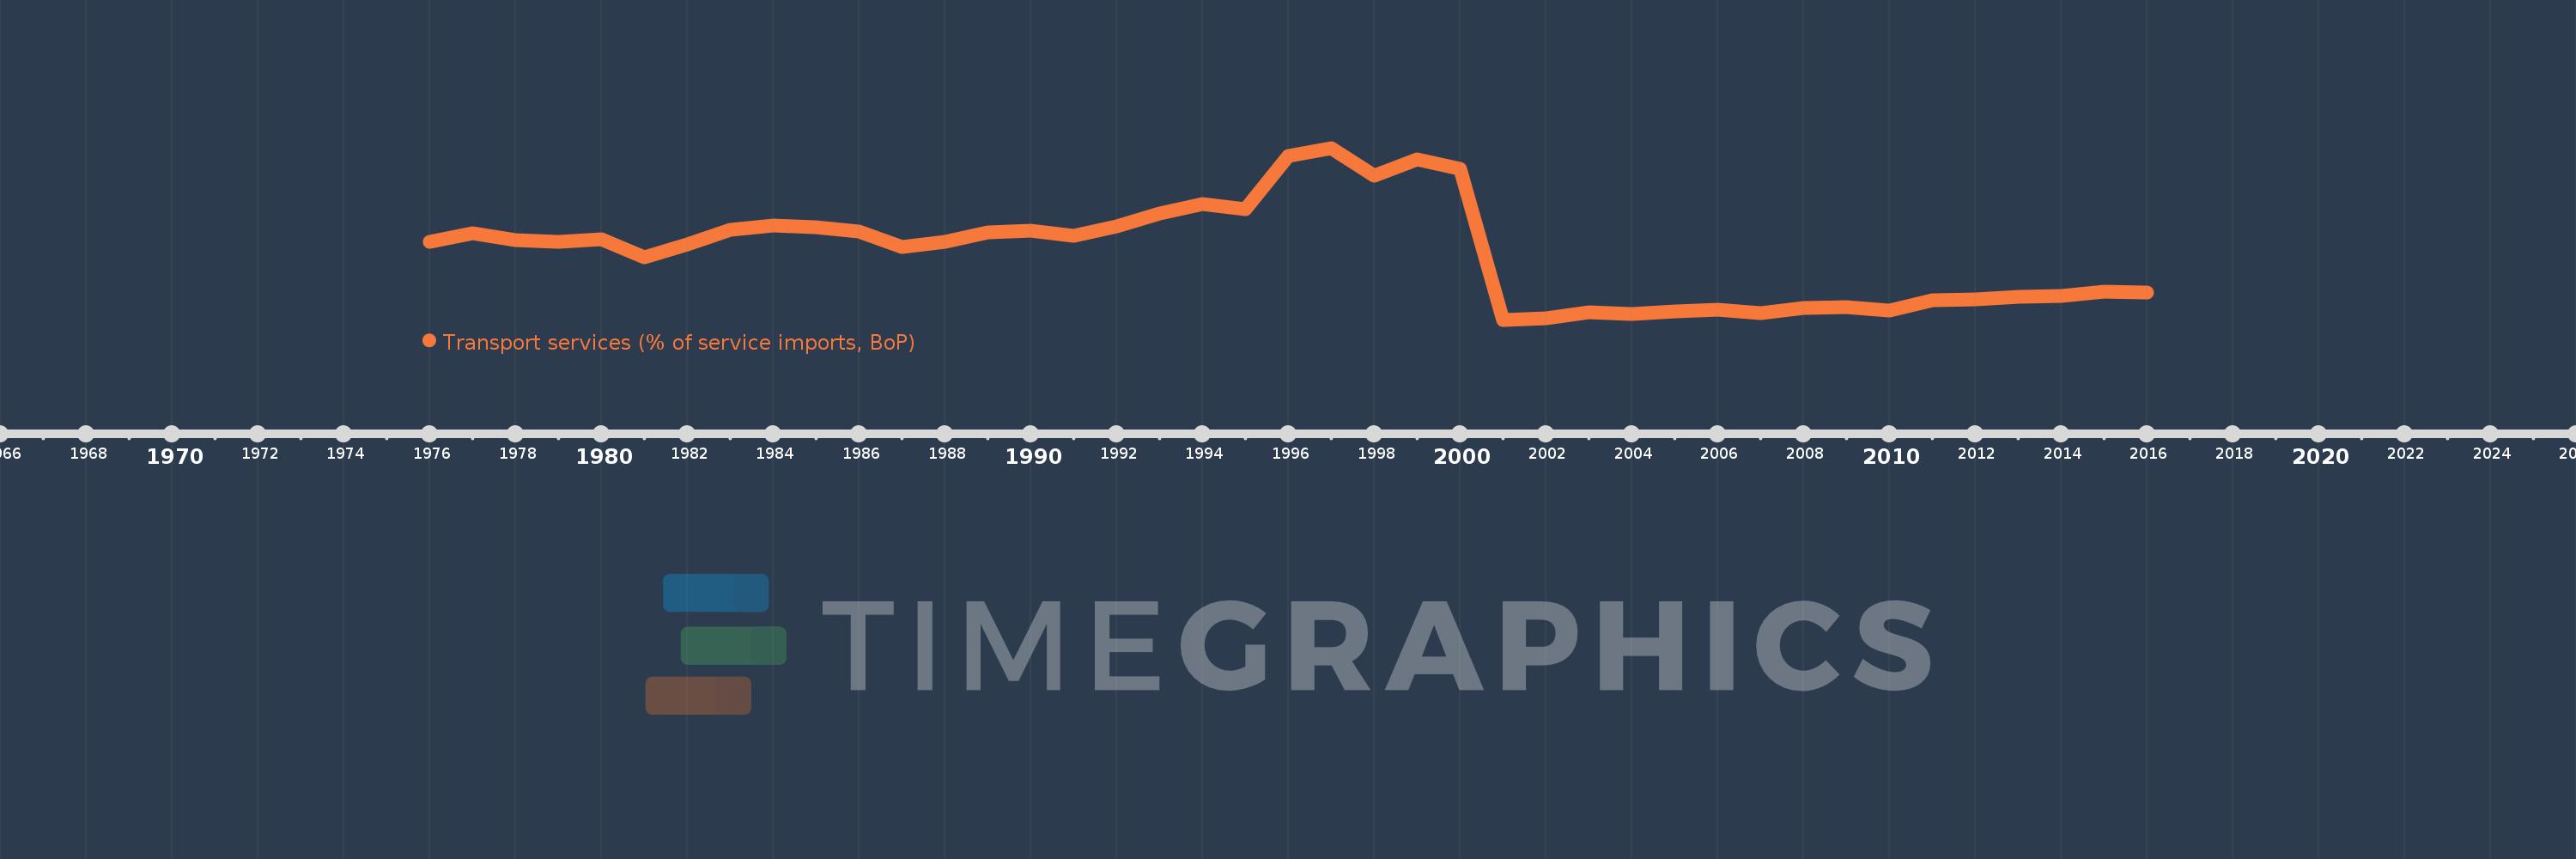
Transport services (% of service imports, BoP)
2016,2015,2014,2013,2012,2011,2010,2009,2008,2007,2006,2005,2004,2003,2002,2001,2000,1999,1998,1997,1996,1995,1994,1993,1992,1991,1990,1989,1988,1987,1986,1985,1984,1983,1982,1981,1980,1979,1978,1977,1976
This statistics in other country:
AfghanistanAlbaniaAlgeriaAngolaAntigua and BarbudaArab WorldArgentinaArmeniaArubaAustraliaAustriaAzerbaijanBahamas, TheBahrainBangladeshBarbadosBelarusBelgiumBelizeBeninBermudaBhutanBoliviaBosnia and HerzegovinaBotswanaBrazilBrunei DarussalamBulgariaBurkina FasoBurundiCabo VerdeCambodiaCameroonCanadaCaribbean small statesCentral African RepublicCentral Europe and the BalticsChadChileChinaColombiaComorosCongo, Dem. Rep.Congo, Rep.Costa RicaCote d'IvoireCroatiaCuracaoCyprusCzech RepublicDenmarkDjiboutiDominicaDominican RepublicEarly-demographic dividendEast Asia & PacificEast Asia & Pacific (excluding high income)East Asia & Pacific (IDA & IBRD countries)EcuadorEgypt, Arab Rep.El SalvadorEquatorial GuineaEritreaEstoniaEthiopiaEuro areaEurope & Central AsiaEurope & Central Asia (excluding high income)Europe & Central Asia (IDA & IBRD countries)European UnionFaroe IslandsFijiFinlandFragile and conflict affected situationsFranceFrench PolynesiaGabonGambia, TheGeorgiaGermanyGhanaGreeceGrenadaGuatemalaGuineaGuinea-BissauGuyanaHaitiHeavily indebted poor countries (HIPC)High incomeHondurasHong Kong SAR, ChinaHungaryIBRD onlyIcelandIDA & IBRD totalIDA onlyIDA totalIndiaIndonesiaIran, Islamic Rep.IraqIrelandIsraelItalyJamaicaJapanJordanKazakhstanKenyaKiribatiKorea, Rep.KosovoKuwaitKyrgyz RepublicLao PDRLate-demographic dividendLatin America & Caribbean Latin America & Caribbean (excluding high income)Latin America & the Caribbean (IDA & IBRD countries)LatviaLeast developed countries: UN classificationLebanonLesothoLiberiaLibyaLithuaniaLow & middle incomeLow incomeLower middle incomeLuxembourgMacao SAR, ChinaMacedonia, FYRMadagascarMalawiMalaysiaMaldivesMaliMaltaMarshall IslandsMauritaniaMauritiusMexicoMicronesia, Fed. Sts.Middle East & North AfricaMiddle East & North Africa (excluding high income)Middle East & North Africa (IDA & IBRD countries)Middle incomeMoldovaMongoliaMontenegroMoroccoMozambiqueMyanmarNamibiaNepalNetherlandsNew CaledoniaNew ZealandNicaraguaNigerNigeriaNorth AmericaNorwayOECD membersOmanOther small statesPacific island small statesPakistanPalauPanamaPapua New GuineaParaguayPeruPhilippinesPolandPortugalPost-demographic dividendPre-demographic dividendQatarRomaniaRussian FederationRwandaSamoaSao Tome and PrincipeSaudi ArabiaSenegalSerbiaSeychellesSierra LeoneSingaporeSint Maarten (Dutch part)Slovak RepublicSloveniaSmall statesSolomon IslandsSouth AfricaSouth AsiaSouth Asia (IDA & IBRD)South SudanSpainSri LankaSt. Kitts and NevisSt. LuciaSt. Vincent and the GrenadinesSub-Saharan Africa Sub-Saharan Africa (excluding high income)Sub-Saharan Africa (IDA & IBRD countries)SudanSurinameSwazilandSwedenSwitzerlandSyrian Arab RepublicTajikistanTanzaniaThailandTimor-LesteTogoTongaTrinidad and TobagoTunisiaTurkeyTuvaluUgandaUkraineUnited KingdomUnited StatesUpper middle incomeUruguayVanuatuVenezuela, RBWest Bank and GazaWorldYemen, Rep.ZambiaZimbabwe Timeline:
This timeline shows a graph from 1976 to 2016 of Lesotho. No data until 1975. Number of actual observations by date: 41.
Source name:
World Development Indicators
Source organization:
International Monetary Fund, Balance of Payments Statistics Yearbook and data files.
Categories, topics:
Economy & Growth, Trade
Last updated:
apr 23, 2017
Indicators value changes by year
Maximum:
74.885
jan 1, 1997
At the date of observation
Value
Absolute change
Change from previous value
jan 1, 1976
37.872
+37.872
0.0%
jan 1, 1977
41.319
+3.446
9.1%
jan 1, 1978
38.657
-2.661
-6.44%
jan 1, 1979
37.731
-0.927
-2.4%
jan 1, 1980
38.889
+1.158
3.07%
jan 1, 1981
31.607
-7.282
-18.72%
jan 1, 1982
36.86
+5.252
16.62%
jan 1, 1983
42.405
+5.545
15.04%
jan 1, 1984
44.243
+1.838
4.34%
jan 1, 1985
43.465
-0.778
-1.76%
jan 1, 1986
42.014
-1.45
-3.34%
jan 1, 1987
35.713
-6.302
-15.0%
jan 1, 1988
37.853
+2.14
5.99%
jan 1, 1989
41.641
+3.788
10.01%
jan 1, 1990
42.089
+0.448
1.08%
jan 1, 1991
40.181
-1.909
-4.54%
jan 1, 1992
43.853
+3.673
9.14%
jan 1, 1993
48.972
+5.119
11.67%
jan 1, 1994
52.655
+3.683
7.52%
jan 1, 1995
50.829
-1.826
-3.47%
jan 1, 1996
71.657
+20.828
40.98%
jan 1, 1997
74.885
+3.228
4.5%
jan 1, 1998
64.014
-10.871
-14.52%
jan 1, 1999
70.321
+6.307
9.85%
jan 1, 2000
66.675
-3.646
-5.18%
jan 1, 2001
7.063
-59.612
-89.41%
jan 1, 2002
7.736
+0.673
9.53%
jan 1, 2003
10.004
+2.268
29.32%
jan 1, 2004
9.381
-0.623
-6.22%
jan 1, 2005
10.302
+0.921
9.82%
jan 1, 2006
11.01
+0.708
6.87%
jan 1, 2007
9.81
-1.2
-10.9%
jan 1, 2008
11.614
+1.804
18.39%
jan 1, 2009
11.888
+0.274
2.35%
jan 1, 2010
10.761
-1.127
-9.48%
jan 1, 2011
14.929
+4.168
38.74%
jan 1, 2012
15.116
+0.186
1.25%
jan 1, 2013
16.25
+1.134
7.5%
jan 1, 2014
16.48
+0.23
1.42%
jan 1, 2015
18.108
+1.628
9.88%
jan 1, 2016
17.974
-0.134
-0.74%
Ranking of countries by current statistics by years


Comments: