29
/
en
AIzaSyAYiBZKx7MnpbEhh9jyipgxe19OcubqV5w
April 1, 2024
105562
Chile
CHL
true
2
1
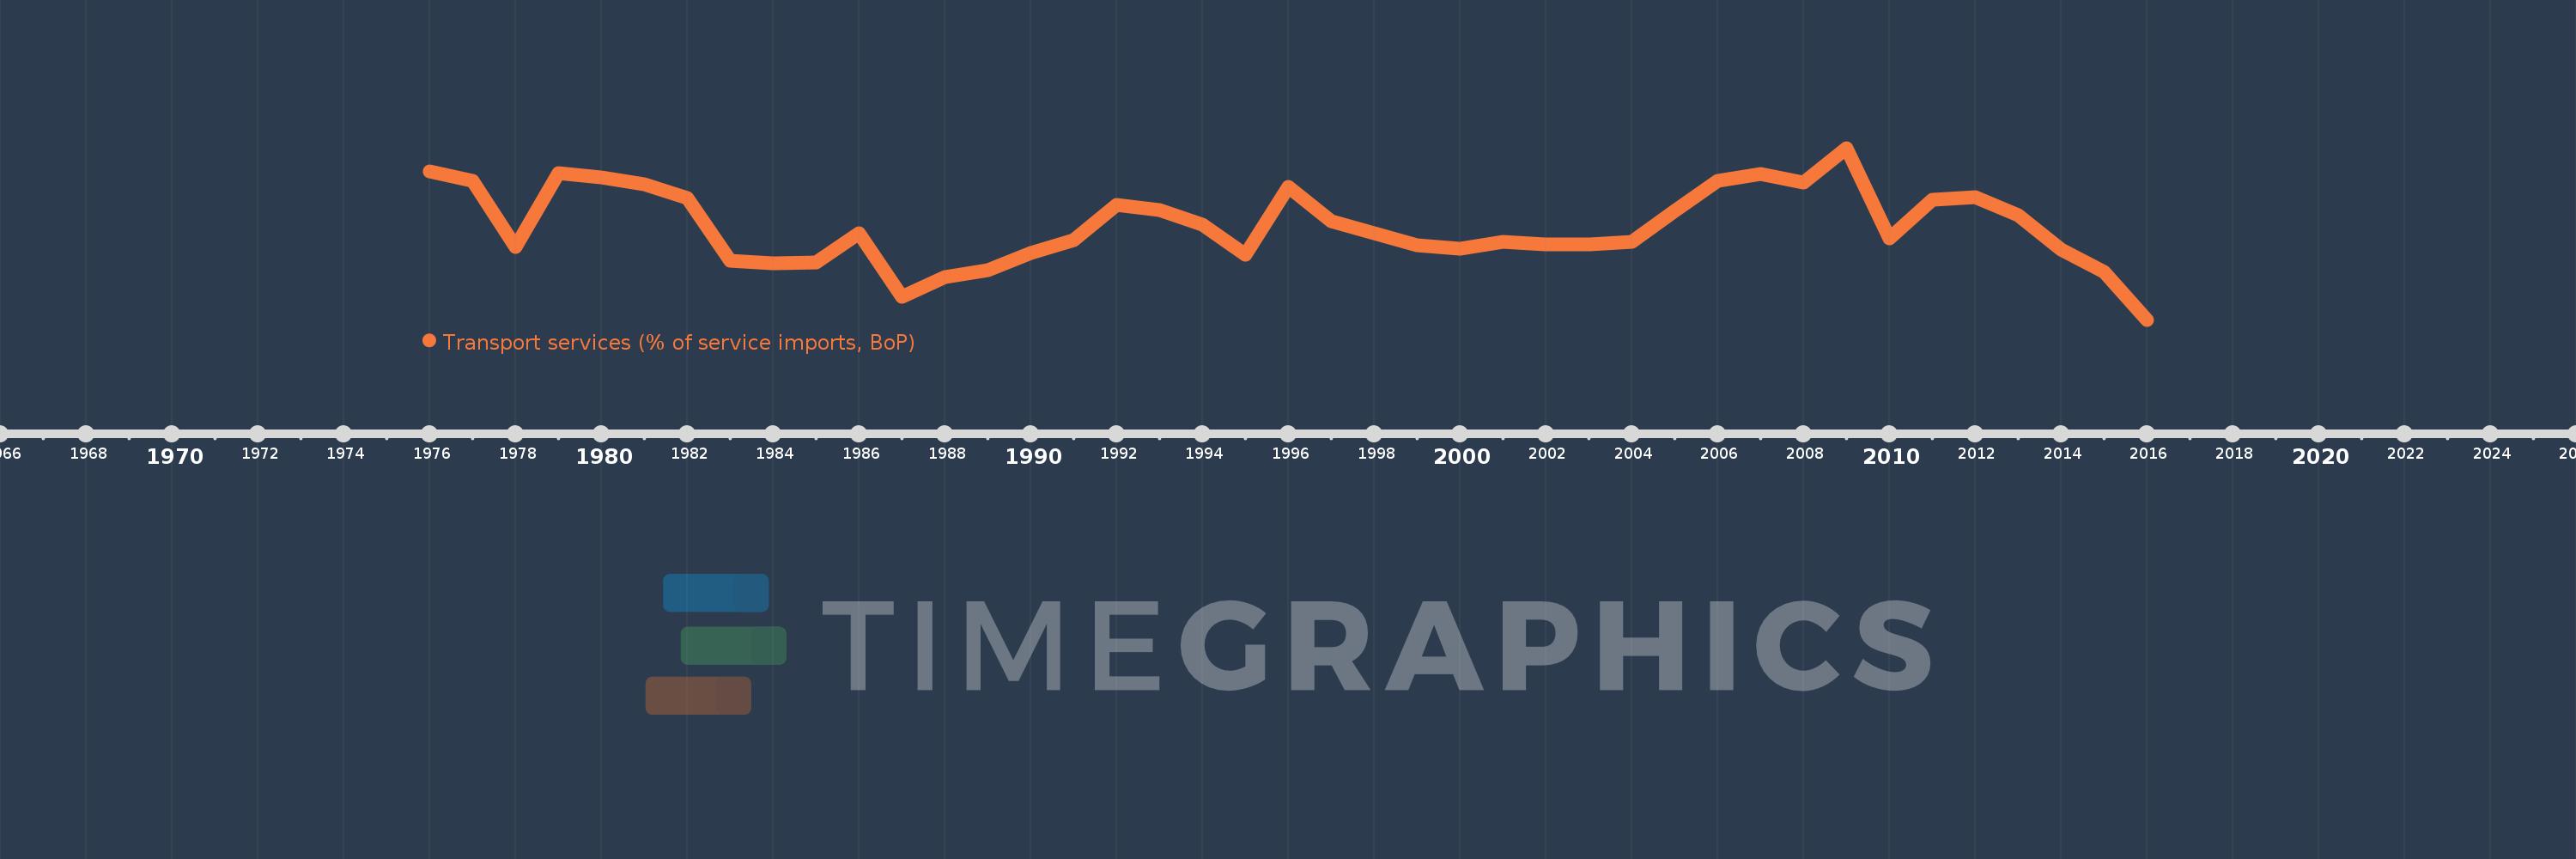
Transport services (% of service imports, BoP)
2016,2015,2014,2013,2012,2011,2010,2009,2008,2007,2006,2005,2004,2003,2002,2001,2000,1999,1998,1997,1996,1995,1994,1993,1992,1991,1990,1989,1988,1987,1986,1985,1984,1983,1982,1981,1980,1979,1978,1977,1976
This statistics in other country:
AfghanistanAlbaniaAlgeriaAngolaAntigua and BarbudaArab WorldArgentinaArmeniaArubaAustraliaAustriaAzerbaijanBahamas, TheBahrainBangladeshBarbadosBelarusBelgiumBelizeBeninBermudaBhutanBoliviaBosnia and HerzegovinaBotswanaBrazilBrunei DarussalamBulgariaBurkina FasoBurundiCabo VerdeCambodiaCameroonCanadaCaribbean small statesCentral African RepublicCentral Europe and the BalticsChadChileChinaColombiaComorosCongo, Dem. Rep.Congo, Rep.Costa RicaCote d'IvoireCroatiaCuracaoCyprusCzech RepublicDenmarkDjiboutiDominicaDominican RepublicEarly-demographic dividendEast Asia & PacificEast Asia & Pacific (excluding high income)East Asia & Pacific (IDA & IBRD countries)EcuadorEgypt, Arab Rep.El SalvadorEquatorial GuineaEritreaEstoniaEthiopiaEuro areaEurope & Central AsiaEurope & Central Asia (excluding high income)Europe & Central Asia (IDA & IBRD countries)European UnionFaroe IslandsFijiFinlandFragile and conflict affected situationsFranceFrench PolynesiaGabonGambia, TheGeorgiaGermanyGhanaGreeceGrenadaGuatemalaGuineaGuinea-BissauGuyanaHaitiHeavily indebted poor countries (HIPC)High incomeHondurasHong Kong SAR, ChinaHungaryIBRD onlyIcelandIDA & IBRD totalIDA onlyIDA totalIndiaIndonesiaIran, Islamic Rep.IraqIrelandIsraelItalyJamaicaJapanJordanKazakhstanKenyaKiribatiKorea, Rep.KosovoKuwaitKyrgyz RepublicLao PDRLate-demographic dividendLatin America & Caribbean Latin America & Caribbean (excluding high income)Latin America & the Caribbean (IDA & IBRD countries)LatviaLeast developed countries: UN classificationLebanonLesothoLiberiaLibyaLithuaniaLow & middle incomeLow incomeLower middle incomeLuxembourgMacao SAR, ChinaMacedonia, FYRMadagascarMalawiMalaysiaMaldivesMaliMaltaMarshall IslandsMauritaniaMauritiusMexicoMicronesia, Fed. Sts.Middle East & North AfricaMiddle East & North Africa (excluding high income)Middle East & North Africa (IDA & IBRD countries)Middle incomeMoldovaMongoliaMontenegroMoroccoMozambiqueMyanmarNamibiaNepalNetherlandsNew CaledoniaNew ZealandNicaraguaNigerNigeriaNorth AmericaNorwayOECD membersOmanOther small statesPacific island small statesPakistanPalauPanamaPapua New GuineaParaguayPeruPhilippinesPolandPortugalPost-demographic dividendPre-demographic dividendQatarRomaniaRussian FederationRwandaSamoaSao Tome and PrincipeSaudi ArabiaSenegalSerbiaSeychellesSierra LeoneSingaporeSint Maarten (Dutch part)Slovak RepublicSloveniaSmall statesSolomon IslandsSouth AfricaSouth AsiaSouth Asia (IDA & IBRD)South SudanSpainSri LankaSt. Kitts and NevisSt. LuciaSt. Vincent and the GrenadinesSub-Saharan Africa Sub-Saharan Africa (excluding high income)Sub-Saharan Africa (IDA & IBRD countries)SudanSurinameSwazilandSwedenSwitzerlandSyrian Arab RepublicTajikistanTanzaniaThailandTimor-LesteTogoTongaTrinidad and TobagoTunisiaTurkeyTuvaluUgandaUkraineUnited KingdomUnited StatesUpper middle incomeUruguayVanuatuVenezuela, RBWest Bank and GazaWorldYemen, Rep.ZambiaZimbabwe Timeline:
This timeline shows a graph from 1976 to 2016 of Chile. No data until 1975. Number of actual observations by date: 41.
Source name:
World Development Indicators
Source organization:
International Monetary Fund, Balance of Payments Statistics Yearbook and data files.
Categories, topics:
Economy & Growth, Trade
Last updated:
apr 23, 2017
Indicators value changes by year
Minimum:
35.047
jan 1, 2016
Maximum:
57.071
jan 1, 2009
At the date of observation
Value
Absolute change
Change from previous value
jan 1, 1976
54.019
+54.019
0.0%
jan 1, 1977
52.816
-1.203
-2.23%
jan 1, 1978
44.414
-8.401
-15.91%
jan 1, 1979
53.795
+9.381
21.12%
jan 1, 1980
53.244
-0.551
-1.02%
jan 1, 1981
52.432
-0.812
-1.53%
jan 1, 1982
50.674
-1.758
-3.35%
jan 1, 1983
42.624
-8.05
-15.89%
jan 1, 1984
42.314
-0.31
-0.73%
jan 1, 1985
42.419
+0.105
0.25%
jan 1, 1986
46.182
+3.763
8.87%
jan 1, 1987
37.997
-8.186
-17.72%
jan 1, 1988
40.499
+2.503
6.59%
jan 1, 1989
41.395
+0.896
2.21%
jan 1, 1990
43.611
+2.216
5.35%
jan 1, 1991
45.224
+1.613
3.7%
jan 1, 1992
49.783
+4.558
10.08%
jan 1, 1993
49.093
-0.69
-1.39%
jan 1, 1994
47.252
-1.841
-3.75%
jan 1, 1995
43.432
-3.821
-8.09%
jan 1, 1996
52.065
+8.633
19.88%
jan 1, 1997
47.642
-4.423
-8.49%
jan 1, 1998
46.096
-1.546
-3.24%
jan 1, 1999
44.625
-1.471
-3.19%
jan 1, 2000
44.201
-0.424
-0.95%
jan 1, 2001
45.046
+0.845
1.91%
jan 1, 2002
44.708
-0.337
-0.75%
jan 1, 2003
44.756
+0.048
0.11%
jan 1, 2004
45.015
+0.259
0.58%
jan 1, 2005
48.991
+3.976
8.83%
jan 1, 2006
52.885
+3.894
7.95%
jan 1, 2007
53.785
+0.9
1.7%
jan 1, 2008
52.671
-1.114
-2.07%
jan 1, 2009
57.071
+4.4
8.35%
jan 1, 2010
45.492
-11.579
-20.29%
jan 1, 2011
50.451
+4.959
10.9%
jan 1, 2012
50.784
+0.333
0.66%
jan 1, 2013
48.468
-2.316
-4.56%
jan 1, 2014
44.078
-4.39
-9.06%
jan 1, 2015
41.204
-2.874
-6.52%
jan 1, 2016
35.047
-6.157
-14.94%
Ranking of countries by current statistics by years


Comments: