30
/
AIzaSyAYiBZKx7MnpbEhh9jyipgxe19OcubqV5w
April 1, 2024
49700
Middle East & North Africa (excluding high income)
MNA
false
2
1
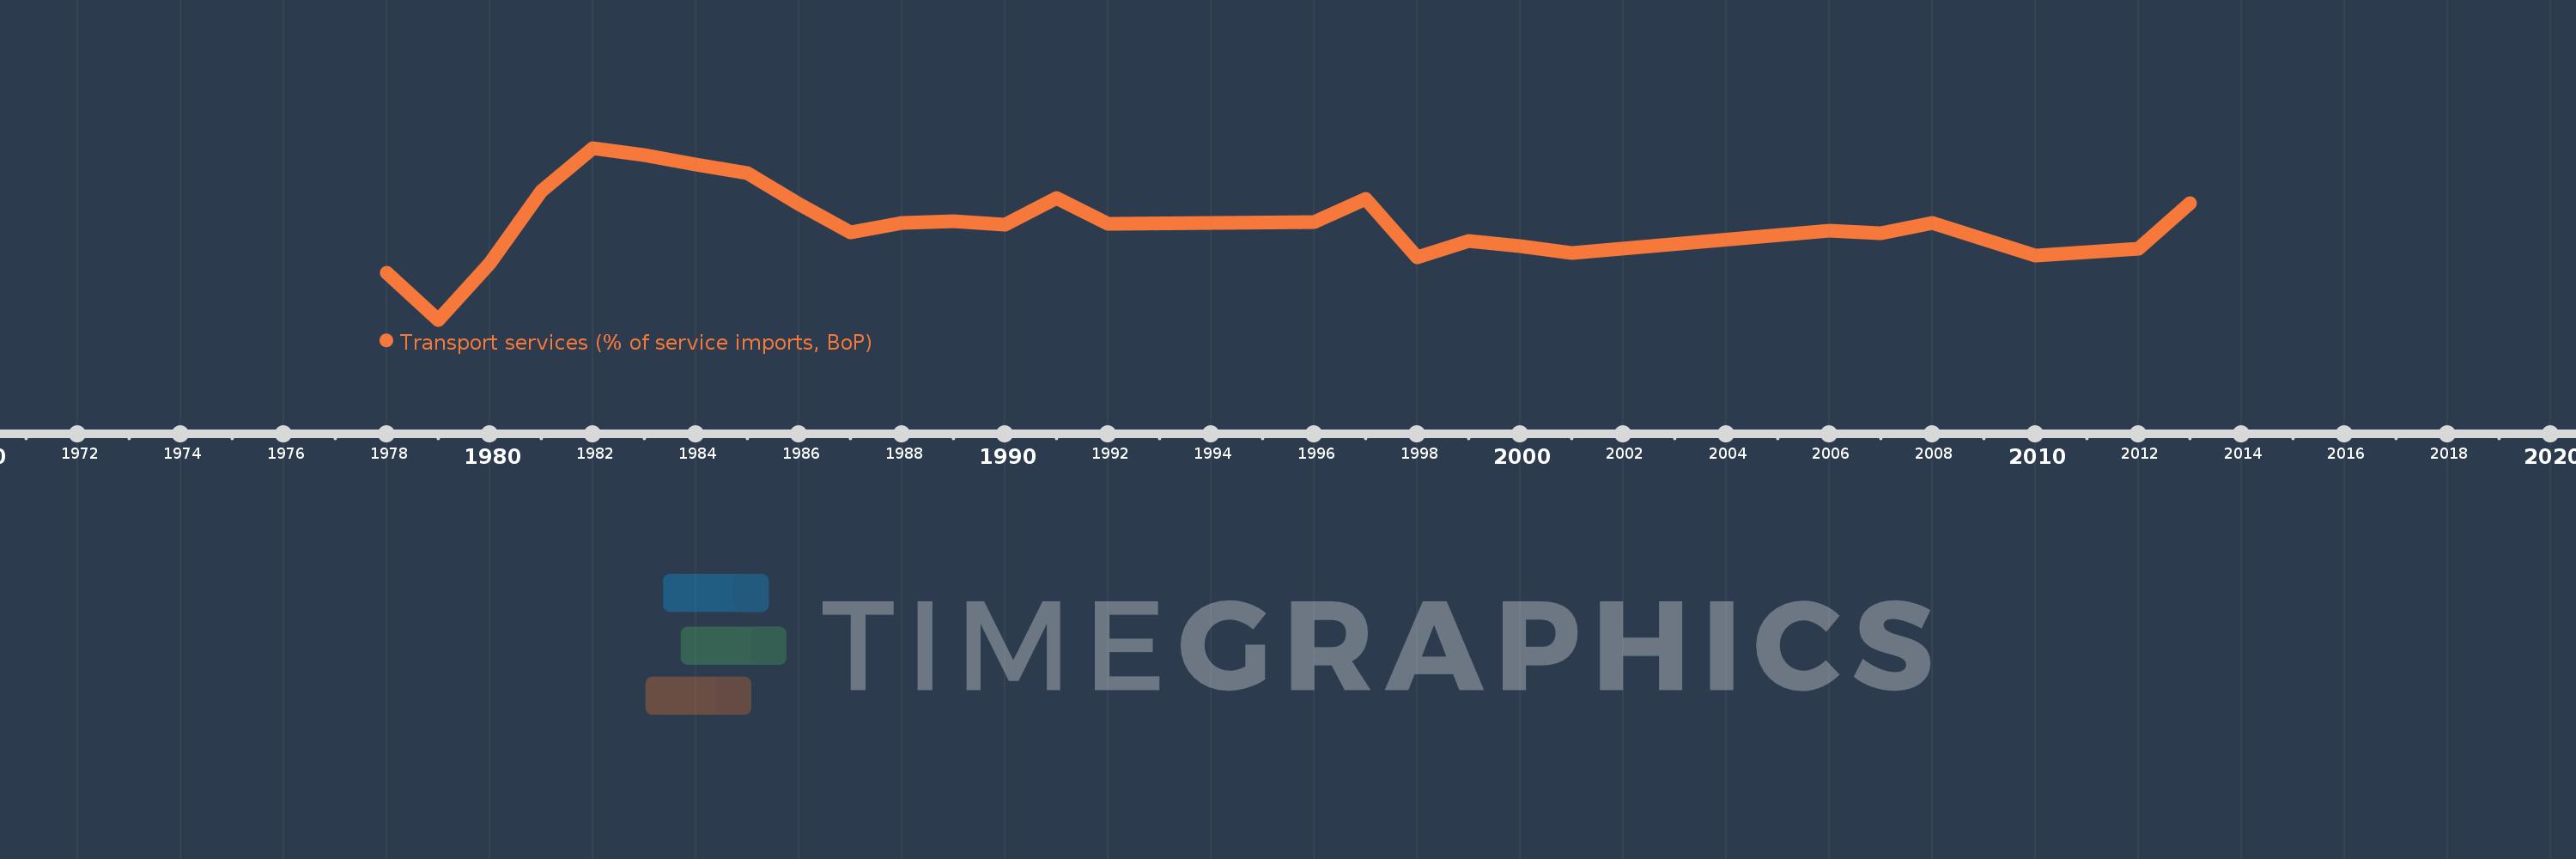
Transport services (% of service imports, BoP)
2013,2012,2011,2010,2009,2008,2007,2006,2001,2000,1999,1998,1997,1996,1992,1991,1990,1989,1988,1987,1986,1985,1984,1983,1982,1981,1980,1979,1978
